Immigrants from Moldova vs Alsatian Doctorate Degree
COMPARE
Immigrants from Moldova
Alsatian
Doctorate Degree
Doctorate Degree Comparison
Immigrants from Moldova
Alsatians
2.0%
DOCTORATE DEGREE
84.3/ 100
METRIC RATING
144th/ 347
METRIC RANK
2.1%
DOCTORATE DEGREE
99.0/ 100
METRIC RATING
93rd/ 347
METRIC RANK
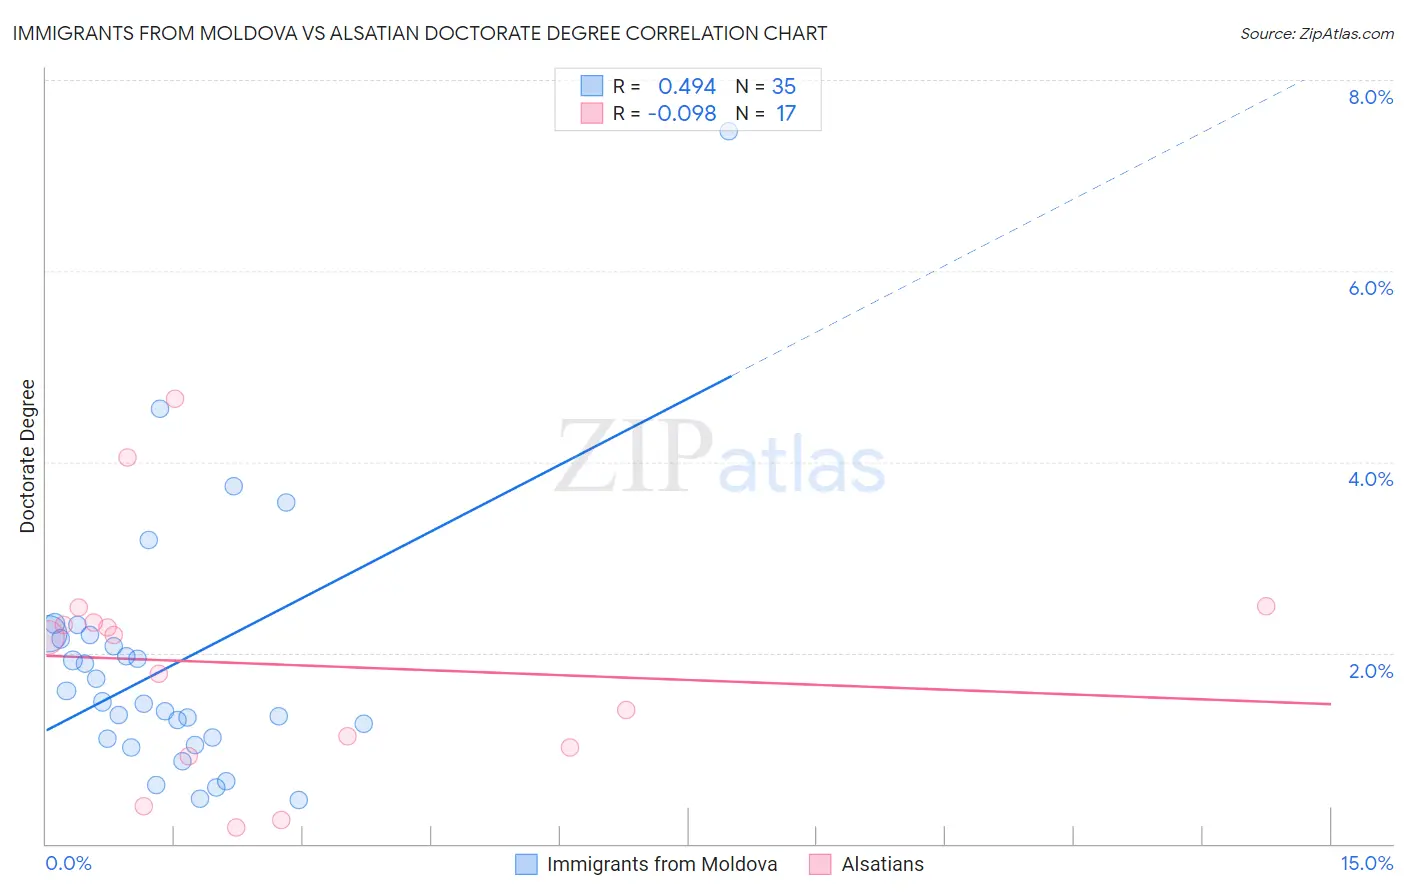
Immigrants from Moldova vs Alsatian Doctorate Degree Correlation Chart
The statistical analysis conducted on geographies consisting of 124,175,458 people shows a moderate positive correlation between the proportion of Immigrants from Moldova and percentage of population with at least doctorate degree education in the United States with a correlation coefficient (R) of 0.494 and weighted average of 2.0%. Similarly, the statistical analysis conducted on geographies consisting of 82,508,744 people shows a slight negative correlation between the proportion of Alsatians and percentage of population with at least doctorate degree education in the United States with a correlation coefficient (R) of -0.098 and weighted average of 2.1%, a difference of 10.0%.
Doctorate Degree Correlation Summary
| Measurement | Immigrants from Moldova | Alsatian |
| Minimum | 0.45% | 0.17% |
| Maximum | 7.5% | 4.7% |
| Range | 7.0% | 4.5% |
| Mean | 1.9% | 1.9% |
| Median | 1.5% | 2.2% |
| Interquartile 25% (IQ1) | 1.1% | 0.96% |
| Interquartile 75% (IQ3) | 2.2% | 2.4% |
| Interquartile Range (IQR) | 1.1% | 1.4% |
| Standard Deviation (Sample) | 1.3% | 1.2% |
| Standard Deviation (Population) | 1.3% | 1.2% |
Similar Demographics by Doctorate Degree
Demographics Similar to Immigrants from Moldova by Doctorate Degree
In terms of doctorate degree, the demographic groups most similar to Immigrants from Moldova are Kenyan (1.9%, a difference of 0.18%), Immigrants from Syria (1.9%, a difference of 0.20%), Sierra Leonean (2.0%, a difference of 0.21%), Immigrants from Senegal (1.9%, a difference of 0.45%), and Italian (2.0%, a difference of 0.46%).
| Demographics | Rating | Rank | Doctorate Degree |
| South American Indians | 88.3 /100 | #137 | Excellent 2.0% |
| Swiss | 88.0 /100 | #138 | Excellent 2.0% |
| Afghans | 87.2 /100 | #139 | Excellent 2.0% |
| Immigrants | Africa | 87.0 /100 | #140 | Excellent 2.0% |
| Senegalese | 86.7 /100 | #141 | Excellent 2.0% |
| Italians | 86.0 /100 | #142 | Excellent 2.0% |
| Sierra Leoneans | 85.1 /100 | #143 | Excellent 2.0% |
| Immigrants | Moldova | 84.3 /100 | #144 | Excellent 2.0% |
| Kenyans | 83.6 /100 | #145 | Excellent 1.9% |
| Immigrants | Syria | 83.6 /100 | #146 | Excellent 1.9% |
| Immigrants | Senegal | 82.5 /100 | #147 | Excellent 1.9% |
| Luxembourgers | 81.1 /100 | #148 | Excellent 1.9% |
| Basques | 76.9 /100 | #149 | Good 1.9% |
| English | 75.9 /100 | #150 | Good 1.9% |
| Albanians | 74.8 /100 | #151 | Good 1.9% |
Demographics Similar to Alsatians by Doctorate Degree
In terms of doctorate degree, the demographic groups most similar to Alsatians are Chilean (2.2%, a difference of 0.22%), Immigrants from Sudan (2.2%, a difference of 0.48%), Greek (2.1%, a difference of 0.64%), Immigrants from Romania (2.1%, a difference of 0.78%), and Immigrants from Scotland (2.2%, a difference of 0.95%).
| Demographics | Rating | Rank | Doctorate Degree |
| Egyptians | 99.4 /100 | #86 | Exceptional 2.2% |
| Immigrants | Zimbabwe | 99.4 /100 | #87 | Exceptional 2.2% |
| Immigrants | Nepal | 99.3 /100 | #88 | Exceptional 2.2% |
| British | 99.3 /100 | #89 | Exceptional 2.2% |
| Immigrants | Scotland | 99.2 /100 | #90 | Exceptional 2.2% |
| Immigrants | Sudan | 99.1 /100 | #91 | Exceptional 2.2% |
| Chileans | 99.1 /100 | #92 | Exceptional 2.2% |
| Alsatians | 99.0 /100 | #93 | Exceptional 2.1% |
| Greeks | 98.8 /100 | #94 | Exceptional 2.1% |
| Immigrants | Romania | 98.7 /100 | #95 | Exceptional 2.1% |
| Immigrants | Northern Africa | 98.4 /100 | #96 | Exceptional 2.1% |
| Immigrants | Eritrea | 98.4 /100 | #97 | Exceptional 2.1% |
| Armenians | 98.3 /100 | #98 | Exceptional 2.1% |
| Immigrants | Egypt | 98.2 /100 | #99 | Exceptional 2.1% |
| Immigrants | Eastern Europe | 98.2 /100 | #100 | Exceptional 2.1% |