Immigrants from Moldova vs Czech Associate's Degree
COMPARE
Immigrants from Moldova
Czech
Associate's Degree
Associate's Degree Comparison
Immigrants from Moldova
Czechs
50.2%
ASSOCIATE'S DEGREE
98.8/ 100
METRIC RATING
87th/ 347
METRIC RANK
47.2%
ASSOCIATE'S DEGREE
72.2/ 100
METRIC RATING
153rd/ 347
METRIC RANK
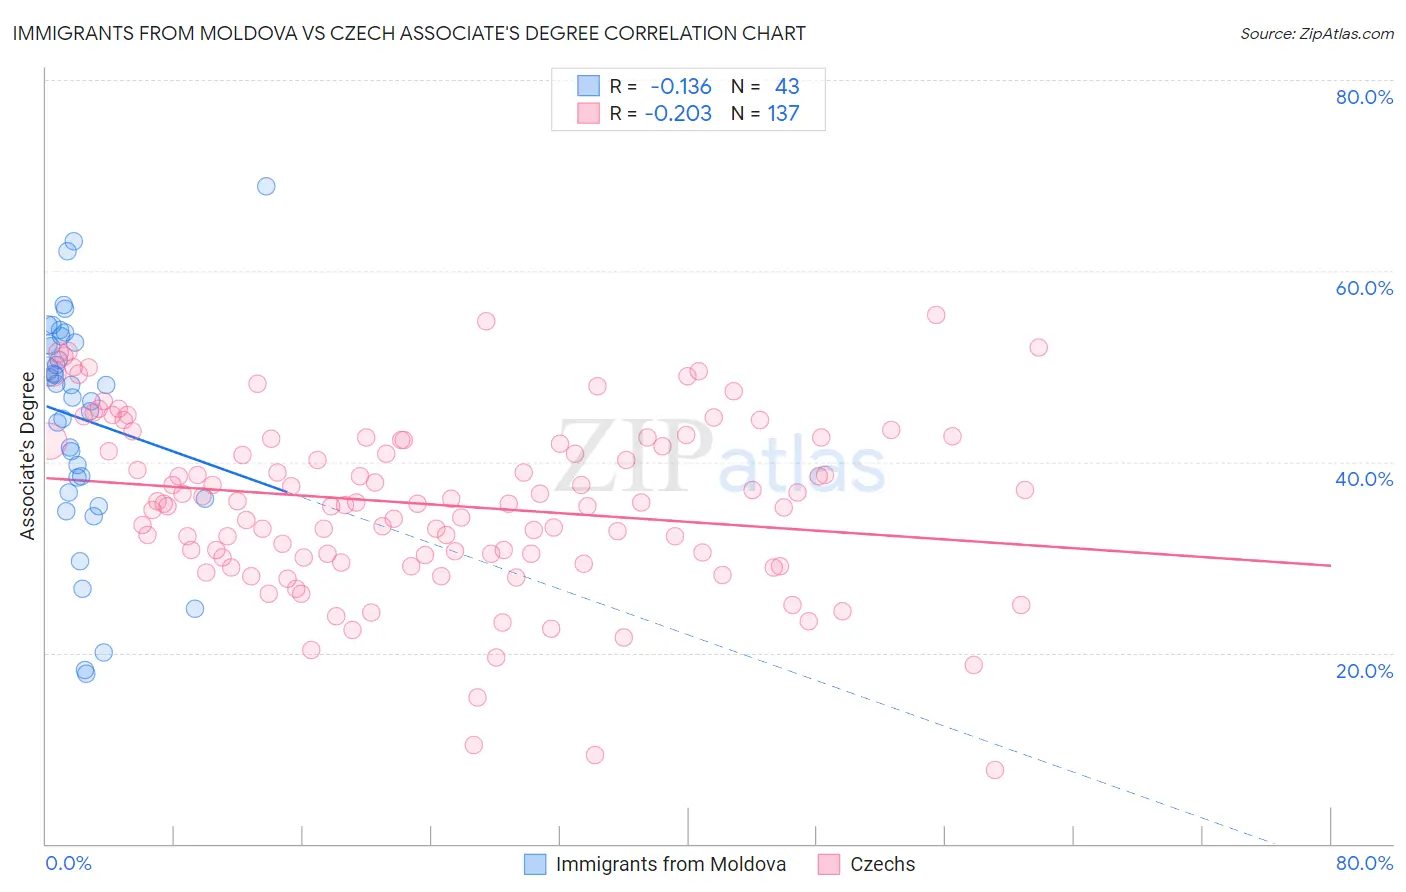
Immigrants from Moldova vs Czech Associate's Degree Correlation Chart
The statistical analysis conducted on geographies consisting of 124,396,308 people shows a poor negative correlation between the proportion of Immigrants from Moldova and percentage of population with at least associate's degree education in the United States with a correlation coefficient (R) of -0.136 and weighted average of 50.2%. Similarly, the statistical analysis conducted on geographies consisting of 484,784,602 people shows a weak negative correlation between the proportion of Czechs and percentage of population with at least associate's degree education in the United States with a correlation coefficient (R) of -0.203 and weighted average of 47.2%, a difference of 6.3%.
Associate's Degree Correlation Summary
| Measurement | Immigrants from Moldova | Czech |
| Minimum | 17.8% | 7.7% |
| Maximum | 68.9% | 55.4% |
| Range | 51.1% | 47.7% |
| Mean | 44.5% | 35.6% |
| Median | 48.0% | 35.7% |
| Interquartile 25% (IQ1) | 36.7% | 30.1% |
| Interquartile 75% (IQ3) | 52.6% | 42.3% |
| Interquartile Range (IQR) | 15.8% | 12.2% |
| Standard Deviation (Sample) | 11.8% | 9.1% |
| Standard Deviation (Population) | 11.6% | 9.0% |
Similar Demographics by Associate's Degree
Demographics Similar to Immigrants from Moldova by Associate's Degree
In terms of associate's degree, the demographic groups most similar to Immigrants from Moldova are Immigrants from Canada (50.1%, a difference of 0.070%), Immigrants from Western Europe (50.1%, a difference of 0.080%), Immigrants from Ethiopia (50.1%, a difference of 0.080%), Immigrants from Croatia (50.2%, a difference of 0.12%), and Immigrants from Egypt (50.2%, a difference of 0.13%).
| Demographics | Rating | Rank | Associate's Degree |
| Armenians | 99.1 /100 | #80 | Exceptional 50.4% |
| Maltese | 99.1 /100 | #81 | Exceptional 50.4% |
| Greeks | 98.9 /100 | #82 | Exceptional 50.3% |
| Immigrants | Uzbekistan | 98.9 /100 | #83 | Exceptional 50.3% |
| Immigrants | Hungary | 98.9 /100 | #84 | Exceptional 50.2% |
| Immigrants | Egypt | 98.9 /100 | #85 | Exceptional 50.2% |
| Immigrants | Croatia | 98.9 /100 | #86 | Exceptional 50.2% |
| Immigrants | Moldova | 98.8 /100 | #87 | Exceptional 50.2% |
| Immigrants | Canada | 98.7 /100 | #88 | Exceptional 50.1% |
| Immigrants | Western Europe | 98.7 /100 | #89 | Exceptional 50.1% |
| Immigrants | Ethiopia | 98.7 /100 | #90 | Exceptional 50.1% |
| Immigrants | Western Asia | 98.7 /100 | #91 | Exceptional 50.1% |
| Immigrants | North America | 98.7 /100 | #92 | Exceptional 50.1% |
| Immigrants | Brazil | 98.5 /100 | #93 | Exceptional 50.0% |
| Laotians | 98.4 /100 | #94 | Exceptional 49.9% |
Demographics Similar to Czechs by Associate's Degree
In terms of associate's degree, the demographic groups most similar to Czechs are Immigrants from Kenya (47.2%, a difference of 0.010%), Kenyan (47.1%, a difference of 0.14%), South American (47.1%, a difference of 0.16%), Sudanese (47.1%, a difference of 0.18%), and Immigrants from Afghanistan (47.3%, a difference of 0.19%).
| Demographics | Rating | Rank | Associate's Degree |
| Immigrants | Sudan | 77.9 /100 | #146 | Good 47.4% |
| Danes | 77.3 /100 | #147 | Good 47.4% |
| South American Indians | 76.7 /100 | #148 | Good 47.4% |
| Immigrants | Armenia | 76.6 /100 | #149 | Good 47.4% |
| Iraqis | 76.2 /100 | #150 | Good 47.4% |
| Immigrants | North Macedonia | 76.0 /100 | #151 | Good 47.4% |
| Immigrants | Afghanistan | 74.3 /100 | #152 | Good 47.3% |
| Czechs | 72.2 /100 | #153 | Good 47.2% |
| Immigrants | Kenya | 72.1 /100 | #154 | Good 47.2% |
| Kenyans | 70.6 /100 | #155 | Good 47.1% |
| South Americans | 70.5 /100 | #156 | Good 47.1% |
| Sudanese | 70.3 /100 | #157 | Good 47.1% |
| Immigrants | Germany | 69.7 /100 | #158 | Good 47.1% |
| Immigrants | Poland | 69.2 /100 | #159 | Good 47.1% |
| Scottish | 65.4 /100 | #160 | Good 46.9% |