Albanian vs Carpatho Rusyn Doctorate Degree

COMPARE

Albanian
Race
Ancestry
AfghanAfricanAlaska NativeAlaskan AthabascanAlbanianAleutAlsatianAmericanApacheArabArapahoArgentineanArmenianAssyrian/Chaldean/SyriacAustralianAustrianBahamianBangladeshiBarbadianBasqueBelgianBelizeanBermudanBhutaneseBlackfeetBolivianBrazilianBritishBritish West IndianBulgarianBurmeseCajunCambodianCanadianCape VerdeanCelticCentral AmericanCentral American IndianCherokeeCheyenneChickasawChileanChineseChippewaChoctawColombianColvilleComancheCosta RicanCreeCreekCroatianCrowCubanCypriotCzechCzechoslovakianDanishDelawareDominicanDutchDutch West IndianEastern EuropeanEcuadorianEgyptianEnglishEstonianEthiopianEuropeanFijianFilipinoFinnishFrenchFrench American IndianFrench CanadianGermanGerman RussianGhanaianGreekGuamanian/ChamorroGuatemalanGuyaneseHaitianHmongHonduranHopiHoumaHungarianIcelanderIndian (Asian)IndonesianInupiatIranianIraqiIrishIroquoisIsraeliItalianJamaicanJapaneseJordanianKenyanKiowaKoreanLaotianLatvianLebaneseLiberianLithuanianLumbeeLuxembourgerMacedonianMalaysianMalteseMarshalleseMenomineeMexicanMexican American IndianMongolianMoroccanNative HawaiianNavajoNepaleseNew ZealanderNicaraguanNigerianNorthern EuropeanNorwegianOkinawanOsageOttawaPaiutePakistaniPalestinianPanamanianParaguayanPennsylvania GermanPeruvianPimaPolishPortuguesePotawatomiPuebloPuerto RicanPuget Sound SalishRomanianRussianSalvadoranSamoanScandinavianScotch-IrishScottishSeminoleSenegaleseSerbianShoshoneSierra LeoneanSiouxSlavicSlovakSloveneSomaliSouth AfricanSouth AmericanSouth American IndianSoviet UnionSpaniardSpanishSpanish AmericanSpanish American IndianSri LankanSubsaharan AfricanSudaneseSwedishSwissSyrianTaiwaneseThaiTlingit-HaidaTohono O'OdhamTonganTrinidadian and TobagonianTsimshianTurkishU.S. Virgin IslanderUgandanUkrainianUruguayanUteVenezuelanVietnameseWelshWest IndianYakamaYaquiYugoslavianYumanYup'ikZimbabwean
Immigration
NonimmigrantsImmigrantsAfghanistanAfricaAlbaniaArgentinaArmeniaAsiaAustraliaAustriaBahamasBangladeshBarbadosBelarusBelgiumBelizeBoliviaBosnia and HerzegovinaBrazilBulgariaBurma/MyanmarCabo VerdeCambodiaCameroonCanadaCaribbeanCentral AmericaChileChinaColombiaCongoCosta RicaCroatiaCubaCzechoslovakiaDenmarkDominicaDominican RepublicEastern AfricaEastern AsiaEastern EuropeEcuadorEgyptEl SalvadorEnglandEritreaEthiopiaEuropeFijiFranceGermanyGhanaGreeceGrenadaGuatemalaGuyanaHaitiHondurasHong KongHungaryIndiaIndonesiaIranIraqIrelandIsraelItalyJamaicaJapanJordanKazakhstanKenyaKoreaKuwaitLaosLatin AmericaLatviaLebanonLiberiaLithuaniaMalaysiaMexicoMicronesiaMiddle AfricaMoldovaMoroccoNepalNetherlandsNicaraguaNigeriaNorth AmericaNorth MacedoniaNorthern AfricaNorthern EuropeNorwayOceaniaPakistanPanamaPeruPhilippinesPolandPortugalRomaniaRussiaSaudi ArabiaScotlandSenegalSerbiaSierra LeoneSingaporeSomaliaSouth AfricaSouth AmericaSouth Central AsiaSouth Eastern AsiaSouthern EuropeSpainSri LankaSt. Vincent and the GrenadinesSudanSwedenSwitzerlandSyriaTaiwanThailandTrinidad and TobagoTurkeyUgandaUkraineUruguayUzbekistanVenezuelaVietnamWest IndiesWestern AfricaWestern AsiaWestern EuropeYemenZaireZimbabweAzores
Carpatho Rusyn
Race
Ancestry
AfghanAfricanAlaska NativeAlaskan AthabascanAleutAlsatianAmericanApacheArabArapahoArgentineanArmenianAssyrian/Chaldean/SyriacAustralianAustrianBahamianBangladeshiBarbadianBasqueBelgianBelizeanBermudanBhutaneseBlackfeetBolivianBrazilianBritishBritish West IndianBulgarianBurmeseCajunCambodianCanadianCape VerdeanCarpatho RusynCelticCentral AmericanCentral American IndianCherokeeCheyenneChickasawChileanChineseChippewaChoctawColombianColvilleComancheCosta RicanCreeCreekCroatianCrowCubanCypriotCzechCzechoslovakianDanishDelawareDominicanDutchDutch West IndianEastern EuropeanEcuadorianEgyptianEnglishEstonianEthiopianEuropeanFijianFilipinoFinnishFrenchFrench American IndianFrench CanadianGermanGerman RussianGhanaianGreekGuamanian/ChamorroGuatemalanGuyaneseHaitianHmongHonduranHopiHoumaHungarianIcelanderIndian (Asian)IndonesianInupiatIranianIraqiIrishIroquoisIsraeliItalianJamaicanJapaneseJordanianKenyanKiowaKoreanLaotianLatvianLebaneseLiberianLithuanianLumbeeLuxembourgerMacedonianMalaysianMalteseMarshalleseMenomineeMexicanMexican American IndianMongolianMoroccanNative HawaiianNavajoNepaleseNew ZealanderNicaraguanNigerianNorthern EuropeanNorwegianOkinawanOsageOttawaPaiutePakistaniPalestinianPanamanianParaguayanPennsylvania GermanPeruvianPimaPolishPortuguesePotawatomiPuebloPuerto RicanPuget Sound SalishRomanianRussianSalvadoranSamoanScandinavianScotch-IrishScottishSeminoleSenegaleseSerbianShoshoneSierra LeoneanSiouxSlavicSlovakSloveneSomaliSouth AfricanSouth AmericanSouth American IndianSoviet UnionSpaniardSpanishSpanish AmericanSpanish American IndianSri LankanSubsaharan AfricanSudaneseSwedishSwissSyrianTaiwaneseThaiTlingit-HaidaTohono O'OdhamTonganTrinidadian and TobagonianTsimshianTurkishU.S. Virgin IslanderUgandanUkrainianUruguayanUteVenezuelanVietnameseWelshWest IndianYakamaYaquiYugoslavianYumanYup'ikZimbabwean
Immigration
NonimmigrantsImmigrantsAfghanistanAfricaAlbaniaArgentinaArmeniaAsiaAustraliaAustriaBahamasBangladeshBarbadosBelarusBelgiumBelizeBoliviaBosnia and HerzegovinaBrazilBulgariaBurma/MyanmarCabo VerdeCambodiaCameroonCanadaCaribbeanCentral AmericaChileChinaColombiaCongoCosta RicaCroatiaCubaCzechoslovakiaDenmarkDominicaDominican RepublicEastern AfricaEastern AsiaEastern EuropeEcuadorEgyptEl SalvadorEnglandEritreaEthiopiaEuropeFijiFranceGermanyGhanaGreeceGrenadaGuatemalaGuyanaHaitiHondurasHong KongHungaryIndiaIndonesiaIranIraqIrelandIsraelItalyJamaicaJapanJordanKazakhstanKenyaKoreaKuwaitLaosLatin AmericaLatviaLebanonLiberiaLithuaniaMalaysiaMexicoMicronesiaMiddle AfricaMoldovaMoroccoNepalNetherlandsNicaraguaNigeriaNorth AmericaNorth MacedoniaNorthern AfricaNorthern EuropeNorwayOceaniaPakistanPanamaPeruPhilippinesPolandPortugalRomaniaRussiaSaudi ArabiaScotlandSenegalSerbiaSierra LeoneSingaporeSomaliaSouth AfricaSouth AmericaSouth Central AsiaSouth Eastern AsiaSouthern EuropeSpainSri LankaSt. Vincent and the GrenadinesSudanSwedenSwitzerlandSyriaTaiwanThailandTrinidad and TobagoTurkeyUgandaUkraineUruguayUzbekistanVenezuelaVietnamWest IndiesWestern AfricaWestern AsiaWestern EuropeYemenZaireZimbabweAzores
Doctorate Degree
Income
Poverty
Unemployment
Labor Participation
Family Structure
Vehicle Availability
Education Level
Disability

Doctorate Degree Comparison

Albanians

Carpatho Rusyns

Good
Exceptional
1.9%
DOCTORATE DEGREE
74.8/ 100
METRIC RATING
151st/ 347
METRIC RANK
2.3%
DOCTORATE DEGREE
99.8/ 100
METRIC RATING
69th/ 347
METRIC RANK

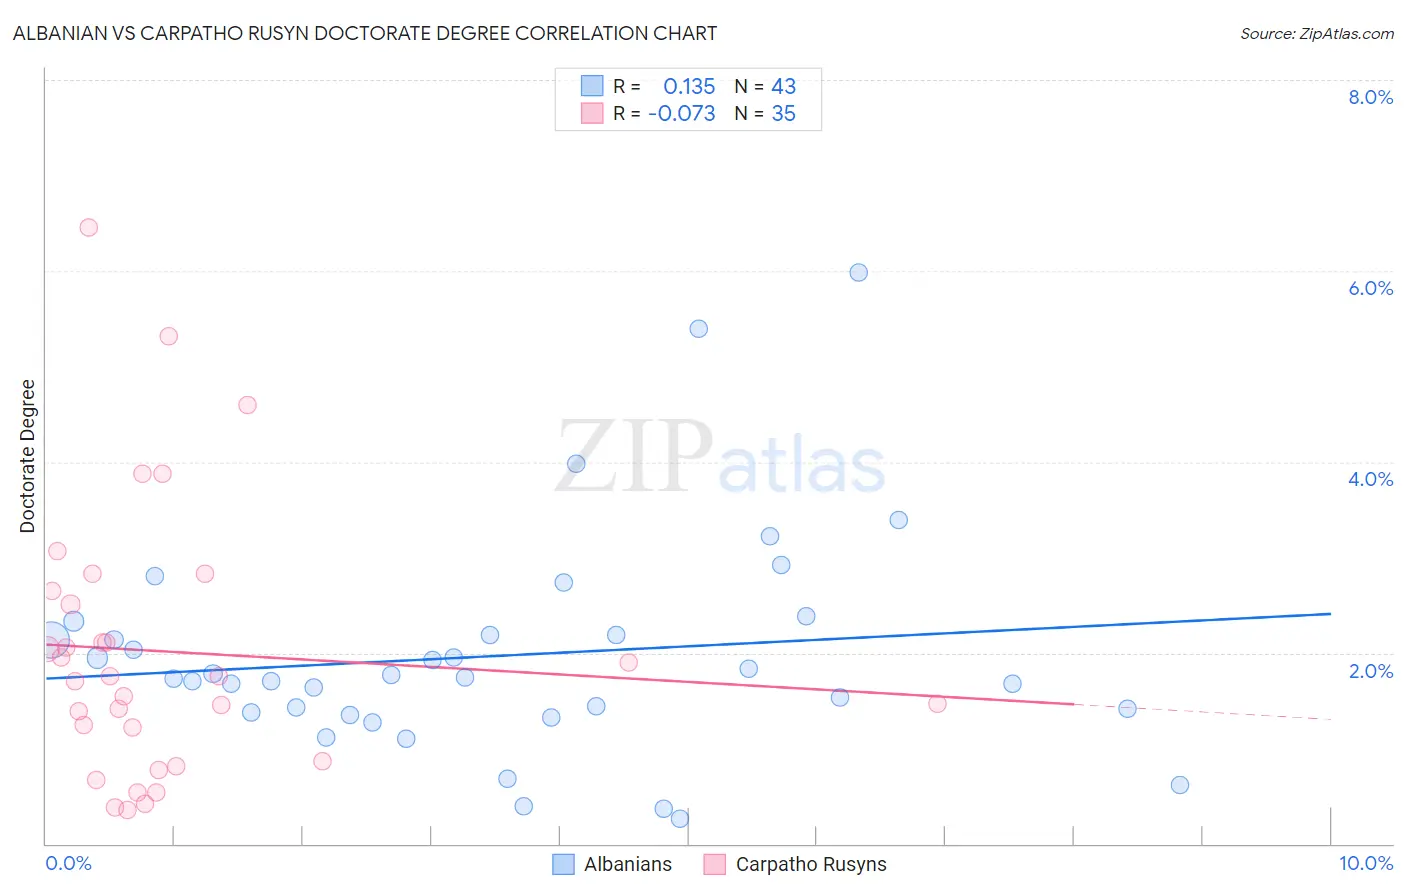
Albanian vs Carpatho Rusyn Doctorate Degree Correlation Chart

The statistical analysis conducted on geographies consisting of 192,567,939 people shows a poor positive correlation between the proportion of Albanians and percentage of population with at least doctorate degree education in the United States with a correlation coefficient (R) of 0.135 and weighted average of 1.9%. Similarly, the statistical analysis conducted on geographies consisting of 58,704,885 people shows a slight negative correlation between the proportion of Carpatho Rusyns and percentage of population with at least doctorate degree education in the United States with a correlation coefficient (R) of -0.073 and weighted average of 2.3%, a difference of 18.3%.
Albanian vs Carpatho Rusyn Doctorate Degree

Doctorate Degree Correlation Summary

MeasurementAlbanianCarpatho Rusyn
Minimum0.26%0.35%
Maximum6.0%6.5%
Range5.7%6.1%
Mean2.0%2.0%
Median1.7%1.8%
Interquartile 25% (IQ1)1.4%0.86%
Interquartile 75% (IQ3)2.2%2.6%
Interquartile Range (IQR)0.81%1.8%
Standard Deviation (Sample)1.1%1.4%
Standard Deviation (Population)1.1%1.4%

Similar Demographics by Doctorate Degree

Demographics Similar to Albanians by Doctorate Degree

In terms of doctorate degree, the demographic groups most similar to Albanians are Immigrants from Kenya (1.9%, a difference of 0.10%), Immigrants from Oceania (1.9%, a difference of 0.15%), English (1.9%, a difference of 0.19%), Immigrants from Albania (1.9%, a difference of 0.37%), and Polish (1.9%, a difference of 0.39%).
DemographicsRating | RankDoctorate Degree
Immigrants | Moldova
84.3
/100
|
#144
Excellent
2.0%
Kenyans
83.6
/100
|
#145
Excellent
1.9%
Immigrants | Syria
83.6
/100
|
#146
Excellent
1.9%
Immigrants | Senegal
82.5
/100
|
#147
Excellent
1.9%
Luxembourgers
81.1
/100
|
#148
Excellent
1.9%
Basques
76.9
/100
|
#149
Good
1.9%
English
75.9
/100
|
#150
Good
1.9%
Albanians
74.8
/100
|
#151
Good
1.9%
Immigrants | Kenya
74.3
/100
|
#152
Good
1.9%
Immigrants | Oceania
74.0
/100
|
#153
Good
1.9%
Immigrants | Albania
72.8
/100
|
#154
Good
1.9%
Poles
72.7
/100
|
#155
Good
1.9%
Slavs
72.4
/100
|
#156
Good
1.9%
Danes
71.9
/100
|
#157
Good
1.9%
Hungarians
71.7
/100
|
#158
Good
1.9%

Demographics Similar to Carpatho Rusyns by Doctorate Degree

In terms of doctorate degree, the demographic groups most similar to Carpatho Rusyns are Lithuanian (2.3%, a difference of 0.14%), Immigrants from Bolivia (2.3%, a difference of 0.14%), Immigrants from Kazakhstan (2.3%, a difference of 0.25%), Immigrants from Canada (2.3%, a difference of 0.30%), and Immigrants from Bulgaria (2.3%, a difference of 0.38%).
DemographicsRating | RankDoctorate Degree
Immigrants | Europe
99.9
/100
|
#62
Exceptional
2.3%
Laotians
99.9
/100
|
#63
Exceptional
2.3%
Immigrants | Greece
99.9
/100
|
#64
Exceptional
2.3%
Paraguayans
99.9
/100
|
#65
Exceptional
2.3%
Argentineans
99.9
/100
|
#66
Exceptional
2.3%
Zimbabweans
99.8
/100
|
#67
Exceptional
2.3%
Immigrants | Kazakhstan
99.8
/100
|
#68
Exceptional
2.3%
Carpatho Rusyns
99.8
/100
|
#69
Exceptional
2.3%
Lithuanians
99.8
/100
|
#70
Exceptional
2.3%
Immigrants | Bolivia
99.8
/100
|
#71
Exceptional
2.3%
Immigrants | Canada
99.8
/100
|
#72
Exceptional
2.3%
Immigrants | Bulgaria
99.8
/100
|
#73
Exceptional
2.3%
Immigrants | North America
99.8
/100
|
#74
Exceptional
2.2%
Immigrants | Western Asia
99.8
/100
|
#75
Exceptional
2.2%
Immigrants | Hungary
99.8
/100
|
#76
Exceptional
2.2%