Immigrants from Asia vs Carpatho Rusyn Doctorate Degree
COMPARE
Immigrants from Asia
Carpatho Rusyn
Doctorate Degree
Doctorate Degree Comparison
Immigrants from Asia
Carpatho Rusyns
2.4%
DOCTORATE DEGREE
100.0/ 100
METRIC RATING
49th/ 347
METRIC RANK
2.3%
DOCTORATE DEGREE
99.8/ 100
METRIC RATING
69th/ 347
METRIC RANK
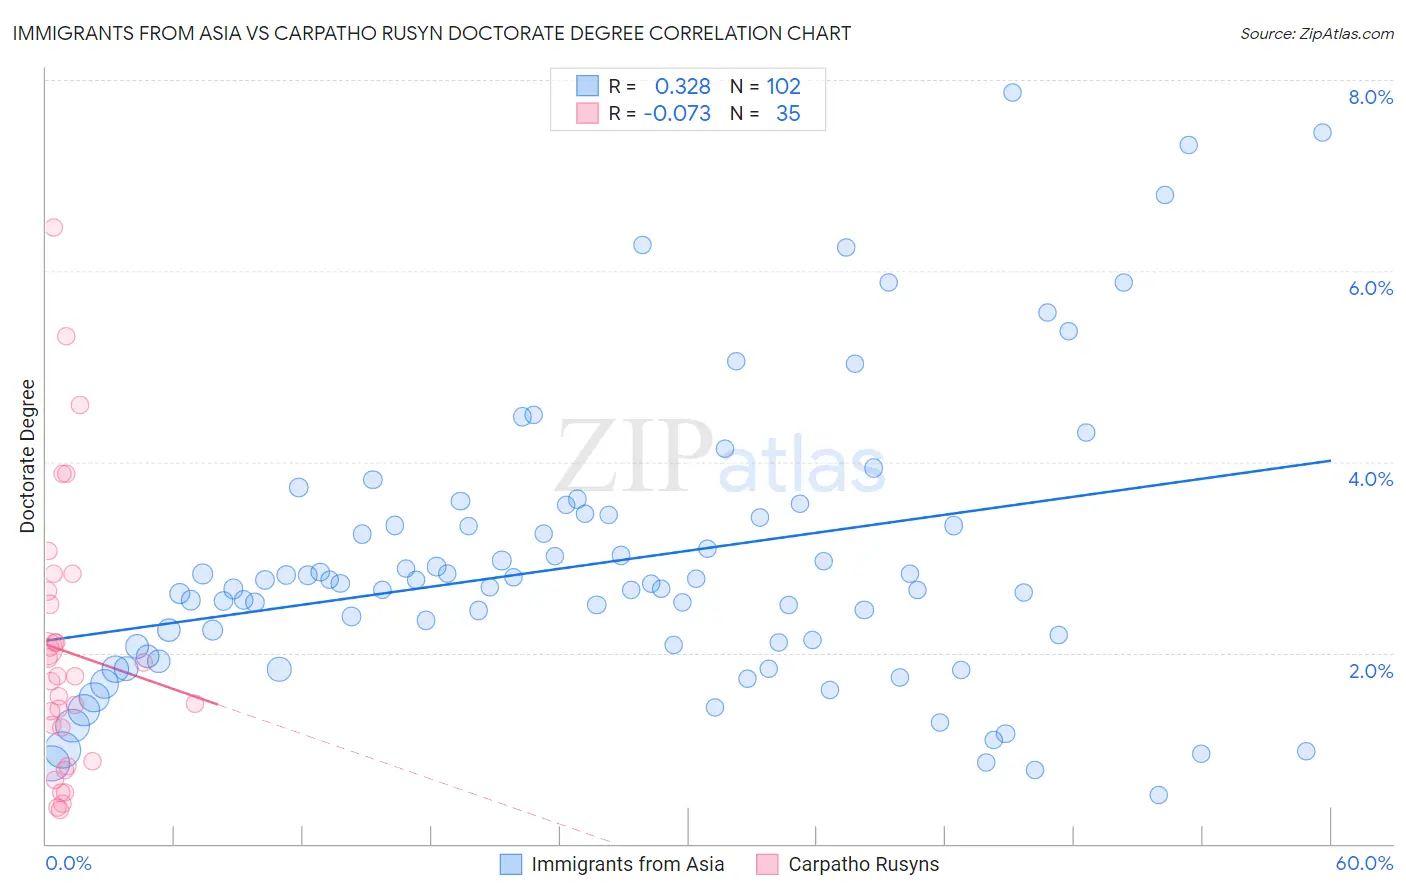
Immigrants from Asia vs Carpatho Rusyn Doctorate Degree Correlation Chart
The statistical analysis conducted on geographies consisting of 533,403,409 people shows a mild positive correlation between the proportion of Immigrants from Asia and percentage of population with at least doctorate degree education in the United States with a correlation coefficient (R) of 0.328 and weighted average of 2.4%. Similarly, the statistical analysis conducted on geographies consisting of 58,704,885 people shows a slight negative correlation between the proportion of Carpatho Rusyns and percentage of population with at least doctorate degree education in the United States with a correlation coefficient (R) of -0.073 and weighted average of 2.3%, a difference of 7.3%.
Doctorate Degree Correlation Summary
| Measurement | Immigrants from Asia | Carpatho Rusyn |
| Minimum | 0.51% | 0.35% |
| Maximum | 7.9% | 6.5% |
| Range | 7.4% | 6.1% |
| Mean | 2.9% | 2.0% |
| Median | 2.7% | 1.8% |
| Interquartile 25% (IQ1) | 2.1% | 0.86% |
| Interquartile 75% (IQ3) | 3.4% | 2.6% |
| Interquartile Range (IQR) | 1.3% | 1.8% |
| Standard Deviation (Sample) | 1.5% | 1.4% |
| Standard Deviation (Population) | 1.5% | 1.4% |
Demographics Similar to Immigrants from Asia and Carpatho Rusyns by Doctorate Degree
In terms of doctorate degree, the demographic groups most similar to Immigrants from Asia are Immigrants from Norway (2.4%, a difference of 1.1%), Australian (2.4%, a difference of 1.2%), Bulgarian (2.4%, a difference of 1.7%), Immigrants from Latvia (2.4%, a difference of 1.8%), and Immigrants from Indonesia (2.4%, a difference of 2.5%). Similarly, the demographic groups most similar to Carpatho Rusyns are Immigrants from Kazakhstan (2.3%, a difference of 0.25%), Zimbabwean (2.3%, a difference of 0.48%), Argentinean (2.3%, a difference of 0.94%), Paraguayan (2.3%, a difference of 1.1%), and Immigrants from Greece (2.3%, a difference of 1.6%).
| Demographics | Rating | Rank | Doctorate Degree |
| Immigrants | Asia | 100.0 /100 | #49 | Exceptional 2.4% |
| Immigrants | Norway | 100.0 /100 | #50 | Exceptional 2.4% |
| Australians | 100.0 /100 | #51 | Exceptional 2.4% |
| Bulgarians | 100.0 /100 | #52 | Exceptional 2.4% |
| Immigrants | Latvia | 100.0 /100 | #53 | Exceptional 2.4% |
| Immigrants | Indonesia | 100.0 /100 | #54 | Exceptional 2.4% |
| Bolivians | 100.0 /100 | #55 | Exceptional 2.4% |
| Immigrants | Czechoslovakia | 100.0 /100 | #56 | Exceptional 2.4% |
| Immigrants | Ethiopia | 100.0 /100 | #57 | Exceptional 2.4% |
| Ethiopians | 99.9 /100 | #58 | Exceptional 2.3% |
| South Africans | 99.9 /100 | #59 | Exceptional 2.3% |
| Immigrants | Serbia | 99.9 /100 | #60 | Exceptional 2.3% |
| Bhutanese | 99.9 /100 | #61 | Exceptional 2.3% |
| Immigrants | Europe | 99.9 /100 | #62 | Exceptional 2.3% |
| Laotians | 99.9 /100 | #63 | Exceptional 2.3% |
| Immigrants | Greece | 99.9 /100 | #64 | Exceptional 2.3% |
| Paraguayans | 99.9 /100 | #65 | Exceptional 2.3% |
| Argentineans | 99.9 /100 | #66 | Exceptional 2.3% |
| Zimbabweans | 99.8 /100 | #67 | Exceptional 2.3% |
| Immigrants | Kazakhstan | 99.8 /100 | #68 | Exceptional 2.3% |
| Carpatho Rusyns | 99.8 /100 | #69 | Exceptional 2.3% |