Immigrants from Middle Africa vs Native Hawaiian Associate's Degree
COMPARE
Immigrants from Middle Africa
Native Hawaiian
Associate's Degree
Associate's Degree Comparison
Immigrants from Middle Africa
Native Hawaiians
44.7%
ASSOCIATE'S DEGREE
12.7/ 100
METRIC RATING
214th/ 347
METRIC RANK
43.1%
ASSOCIATE'S DEGREE
2.3/ 100
METRIC RATING
232nd/ 347
METRIC RANK
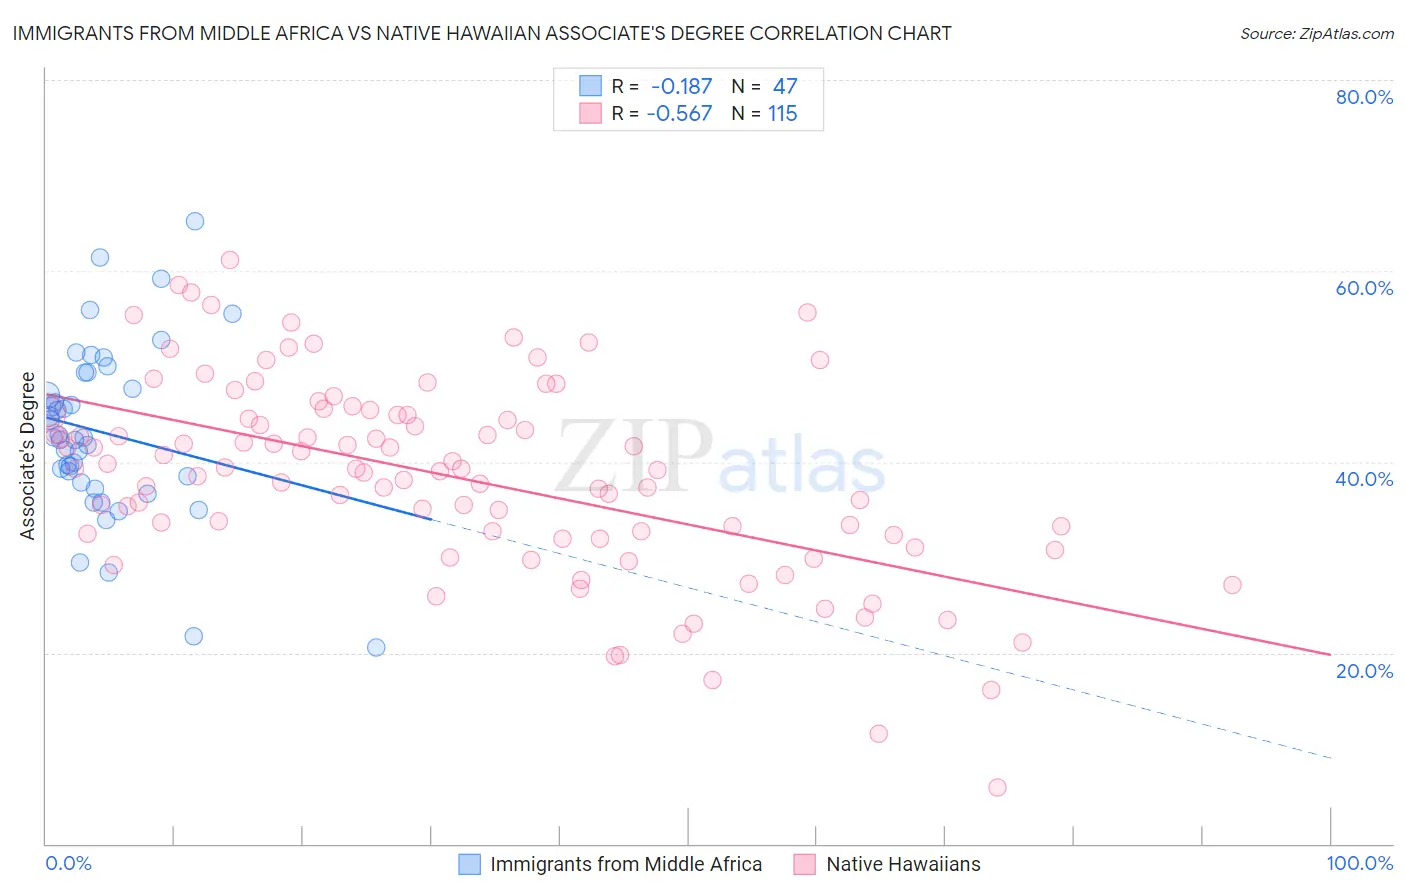
Immigrants from Middle Africa vs Native Hawaiian Associate's Degree Correlation Chart
The statistical analysis conducted on geographies consisting of 202,743,953 people shows a poor negative correlation between the proportion of Immigrants from Middle Africa and percentage of population with at least associate's degree education in the United States with a correlation coefficient (R) of -0.187 and weighted average of 44.7%. Similarly, the statistical analysis conducted on geographies consisting of 332,098,475 people shows a substantial negative correlation between the proportion of Native Hawaiians and percentage of population with at least associate's degree education in the United States with a correlation coefficient (R) of -0.567 and weighted average of 43.1%, a difference of 3.6%.
Associate's Degree Correlation Summary
| Measurement | Immigrants from Middle Africa | Native Hawaiian |
| Minimum | 20.5% | 5.9% |
| Maximum | 65.2% | 61.2% |
| Range | 44.7% | 55.3% |
| Mean | 43.1% | 38.4% |
| Median | 42.6% | 39.3% |
| Interquartile 25% (IQ1) | 37.8% | 32.3% |
| Interquartile 75% (IQ3) | 49.3% | 44.9% |
| Interquartile Range (IQR) | 11.5% | 12.6% |
| Standard Deviation (Sample) | 9.1% | 10.3% |
| Standard Deviation (Population) | 9.0% | 10.3% |
Demographics Similar to Immigrants from Middle Africa and Native Hawaiians by Associate's Degree
In terms of associate's degree, the demographic groups most similar to Immigrants from Middle Africa are Immigrants from Panama (44.7%, a difference of 0.060%), Immigrants from Nigeria (44.6%, a difference of 0.24%), Immigrants from Ghana (44.8%, a difference of 0.25%), Immigrants (44.5%, a difference of 0.42%), and Spanish (44.4%, a difference of 0.67%). Similarly, the demographic groups most similar to Native Hawaiians are Tongan (43.0%, a difference of 0.16%), Immigrants from Barbados (43.3%, a difference of 0.43%), Liberian (43.3%, a difference of 0.43%), Immigrants from Trinidad and Tobago (43.3%, a difference of 0.50%), and Hmong (43.4%, a difference of 0.66%).
| Demographics | Rating | Rank | Associate's Degree |
| Immigrants | Ghana | 14.2 /100 | #213 | Poor 44.8% |
| Immigrants | Middle Africa | 12.7 /100 | #214 | Poor 44.7% |
| Immigrants | Panama | 12.4 /100 | #215 | Poor 44.7% |
| Immigrants | Nigeria | 11.4 /100 | #216 | Poor 44.6% |
| Immigrants | Immigrants | 10.5 /100 | #217 | Poor 44.5% |
| Spanish | 9.4 /100 | #218 | Tragic 44.4% |
| Whites/Caucasians | 7.5 /100 | #219 | Tragic 44.2% |
| Portuguese | 7.2 /100 | #220 | Tragic 44.1% |
| Immigrants | Western Africa | 6.6 /100 | #221 | Tragic 44.1% |
| Barbadians | 5.8 /100 | #222 | Tragic 43.9% |
| Sub-Saharan Africans | 5.5 /100 | #223 | Tragic 43.9% |
| West Indians | 5.2 /100 | #224 | Tragic 43.8% |
| Guamanians/Chamorros | 4.8 /100 | #225 | Tragic 43.8% |
| Immigrants | Burma/Myanmar | 4.3 /100 | #226 | Tragic 43.7% |
| Trinidadians and Tobagonians | 4.0 /100 | #227 | Tragic 43.6% |
| Hmong | 3.2 /100 | #228 | Tragic 43.4% |
| Immigrants | Trinidad and Tobago | 3.0 /100 | #229 | Tragic 43.3% |
| Immigrants | Barbados | 2.9 /100 | #230 | Tragic 43.3% |
| Liberians | 2.9 /100 | #231 | Tragic 43.3% |
| Native Hawaiians | 2.3 /100 | #232 | Tragic 43.1% |
| Tongans | 2.2 /100 | #233 | Tragic 43.0% |