Immigrants from Middle Africa vs Immigrants from Uruguay Associate's Degree
COMPARE
Immigrants from Middle Africa
Immigrants from Uruguay
Associate's Degree
Associate's Degree Comparison
Immigrants from Middle Africa
Immigrants from Uruguay
44.7%
ASSOCIATE'S DEGREE
12.7/ 100
METRIC RATING
214th/ 347
METRIC RANK
45.8%
ASSOCIATE'S DEGREE
35.5/ 100
METRIC RATING
187th/ 347
METRIC RANK
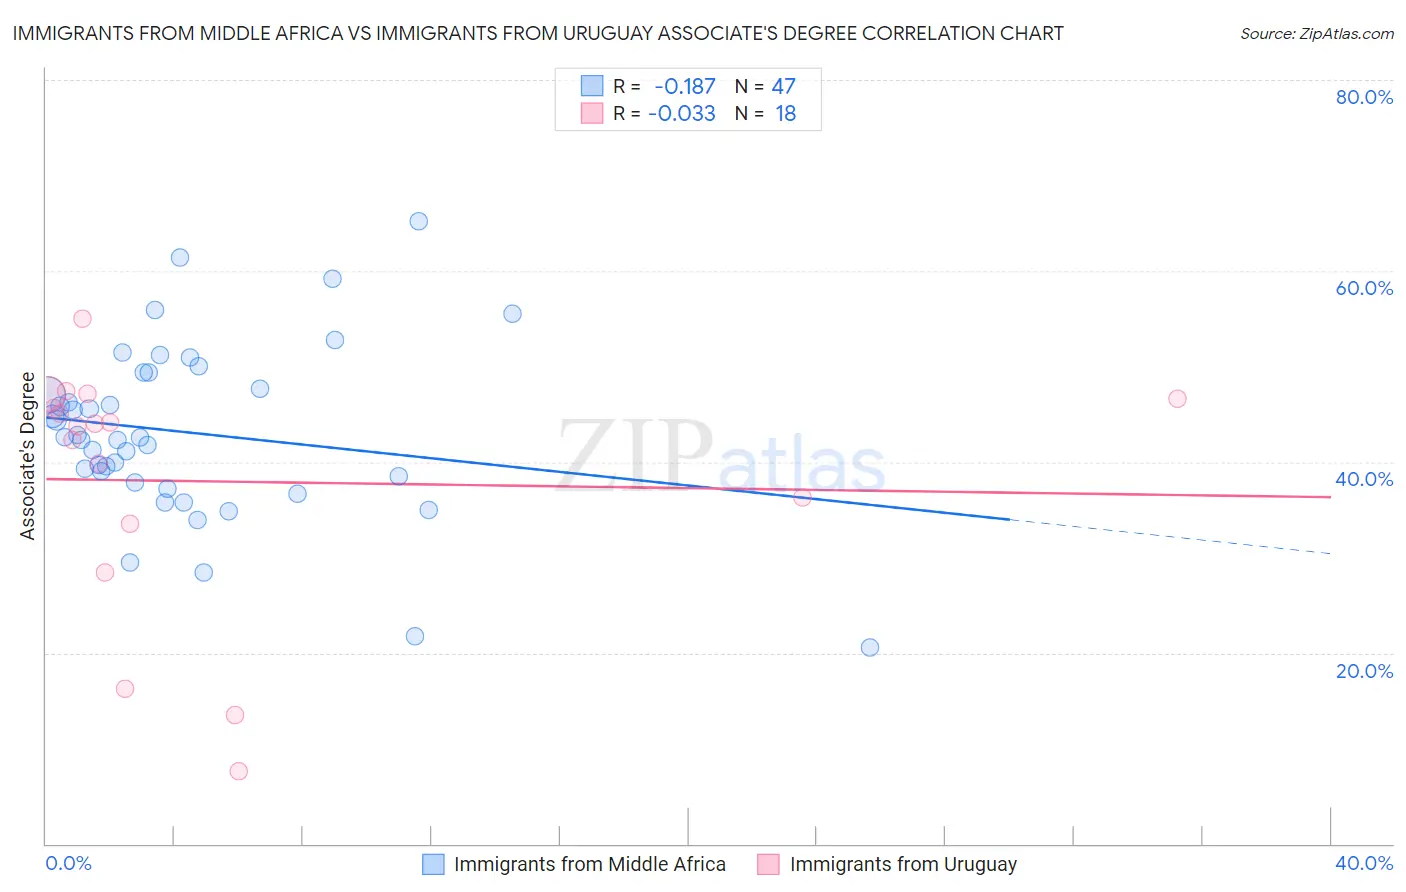
Immigrants from Middle Africa vs Immigrants from Uruguay Associate's Degree Correlation Chart
The statistical analysis conducted on geographies consisting of 202,743,953 people shows a poor negative correlation between the proportion of Immigrants from Middle Africa and percentage of population with at least associate's degree education in the United States with a correlation coefficient (R) of -0.187 and weighted average of 44.7%. Similarly, the statistical analysis conducted on geographies consisting of 133,259,667 people shows no correlation between the proportion of Immigrants from Uruguay and percentage of population with at least associate's degree education in the United States with a correlation coefficient (R) of -0.033 and weighted average of 45.8%, a difference of 2.6%.
Associate's Degree Correlation Summary
| Measurement | Immigrants from Middle Africa | Immigrants from Uruguay |
| Minimum | 20.5% | 7.6% |
| Maximum | 65.2% | 55.0% |
| Range | 44.7% | 47.3% |
| Mean | 43.1% | 38.0% |
| Median | 42.6% | 43.9% |
| Interquartile 25% (IQ1) | 37.8% | 33.5% |
| Interquartile 75% (IQ3) | 49.3% | 46.6% |
| Interquartile Range (IQR) | 11.5% | 13.1% |
| Standard Deviation (Sample) | 9.1% | 13.2% |
| Standard Deviation (Population) | 9.0% | 12.8% |
Similar Demographics by Associate's Degree
Demographics Similar to Immigrants from Middle Africa by Associate's Degree
In terms of associate's degree, the demographic groups most similar to Immigrants from Middle Africa are Immigrants from Panama (44.7%, a difference of 0.060%), Immigrants from Nigeria (44.6%, a difference of 0.24%), Immigrants from Ghana (44.8%, a difference of 0.25%), French Canadian (44.9%, a difference of 0.38%), and Immigrants (44.5%, a difference of 0.42%).
| Demographics | Rating | Rank | Associate's Degree |
| Panamanians | 18.4 /100 | #207 | Poor 45.1% |
| Dutch | 17.6 /100 | #208 | Poor 45.0% |
| Immigrants | Costa Rica | 16.7 /100 | #209 | Poor 45.0% |
| Immigrants | Philippines | 16.7 /100 | #210 | Poor 45.0% |
| Immigrants | Zaire | 16.6 /100 | #211 | Poor 45.0% |
| French Canadians | 15.0 /100 | #212 | Poor 44.9% |
| Immigrants | Ghana | 14.2 /100 | #213 | Poor 44.8% |
| Immigrants | Middle Africa | 12.7 /100 | #214 | Poor 44.7% |
| Immigrants | Panama | 12.4 /100 | #215 | Poor 44.7% |
| Immigrants | Nigeria | 11.4 /100 | #216 | Poor 44.6% |
| Immigrants | Immigrants | 10.5 /100 | #217 | Poor 44.5% |
| Spanish | 9.4 /100 | #218 | Tragic 44.4% |
| Whites/Caucasians | 7.5 /100 | #219 | Tragic 44.2% |
| Portuguese | 7.2 /100 | #220 | Tragic 44.1% |
| Immigrants | Western Africa | 6.6 /100 | #221 | Tragic 44.1% |
Demographics Similar to Immigrants from Uruguay by Associate's Degree
In terms of associate's degree, the demographic groups most similar to Immigrants from Uruguay are Ghanaian (45.8%, a difference of 0.0%), Immigrants from Oceania (45.8%, a difference of 0.060%), Vietnamese (45.8%, a difference of 0.12%), Korean (45.8%, a difference of 0.14%), and Celtic (45.8%, a difference of 0.18%).
| Demographics | Rating | Rank | Associate's Degree |
| Bermudans | 46.4 /100 | #180 | Average 46.2% |
| Immigrants | Colombia | 41.3 /100 | #181 | Average 46.0% |
| Swiss | 40.4 /100 | #182 | Average 46.0% |
| Yugoslavians | 40.2 /100 | #183 | Average 46.0% |
| Czechoslovakians | 40.0 /100 | #184 | Average 46.0% |
| Costa Ricans | 38.6 /100 | #185 | Fair 46.0% |
| Welsh | 37.9 /100 | #186 | Fair 45.9% |
| Immigrants | Uruguay | 35.5 /100 | #187 | Fair 45.8% |
| Ghanaians | 35.5 /100 | #188 | Fair 45.8% |
| Immigrants | Oceania | 34.7 /100 | #189 | Fair 45.8% |
| Vietnamese | 34.0 /100 | #190 | Fair 45.8% |
| Koreans | 33.8 /100 | #191 | Fair 45.8% |
| Celtics | 33.3 /100 | #192 | Fair 45.8% |
| Immigrants | Cameroon | 31.0 /100 | #193 | Fair 45.7% |
| Immigrants | Peru | 27.6 /100 | #194 | Fair 45.5% |