Immigrants from Saudi Arabia vs Native Hawaiian Associate's Degree
COMPARE
Immigrants from Saudi Arabia
Native Hawaiian
Associate's Degree
Associate's Degree Comparison
Immigrants from Saudi Arabia
Native Hawaiians
52.6%
ASSOCIATE'S DEGREE
99.9/ 100
METRIC RATING
41st/ 347
METRIC RANK
43.1%
ASSOCIATE'S DEGREE
2.3/ 100
METRIC RATING
232nd/ 347
METRIC RANK
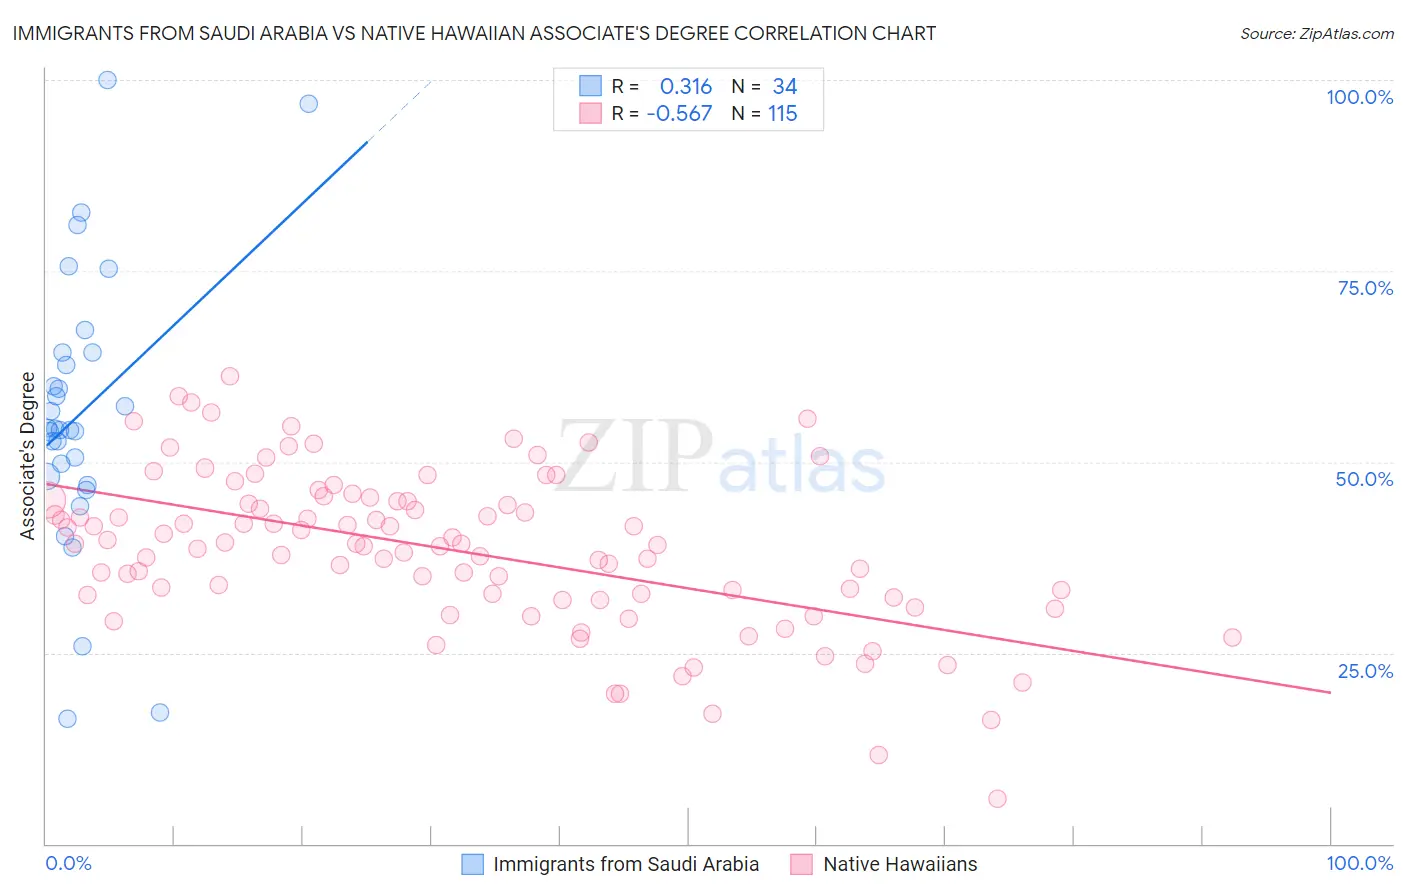
Immigrants from Saudi Arabia vs Native Hawaiian Associate's Degree Correlation Chart
The statistical analysis conducted on geographies consisting of 164,289,450 people shows a mild positive correlation between the proportion of Immigrants from Saudi Arabia and percentage of population with at least associate's degree education in the United States with a correlation coefficient (R) of 0.316 and weighted average of 52.6%. Similarly, the statistical analysis conducted on geographies consisting of 332,098,475 people shows a substantial negative correlation between the proportion of Native Hawaiians and percentage of population with at least associate's degree education in the United States with a correlation coefficient (R) of -0.567 and weighted average of 43.1%, a difference of 21.9%.
Associate's Degree Correlation Summary
| Measurement | Immigrants from Saudi Arabia | Native Hawaiian |
| Minimum | 16.3% | 5.9% |
| Maximum | 100.0% | 61.2% |
| Range | 83.7% | 55.3% |
| Mean | 56.4% | 38.4% |
| Median | 54.3% | 39.3% |
| Interquartile 25% (IQ1) | 48.1% | 32.3% |
| Interquartile 75% (IQ3) | 64.3% | 44.9% |
| Interquartile Range (IQR) | 16.2% | 12.6% |
| Standard Deviation (Sample) | 18.3% | 10.3% |
| Standard Deviation (Population) | 18.1% | 10.3% |
Similar Demographics by Associate's Degree
Demographics Similar to Immigrants from Saudi Arabia by Associate's Degree
In terms of associate's degree, the demographic groups most similar to Immigrants from Saudi Arabia are Immigrants from Malaysia (52.5%, a difference of 0.030%), Immigrants from South Africa (52.5%, a difference of 0.040%), Estonian (52.5%, a difference of 0.13%), Immigrants from Lithuania (52.4%, a difference of 0.20%), and Immigrants from Bulgaria (52.4%, a difference of 0.34%).
| Demographics | Rating | Rank | Associate's Degree |
| Bulgarians | 100.0 /100 | #34 | Exceptional 53.3% |
| Russians | 100.0 /100 | #35 | Exceptional 53.2% |
| Immigrants | Russia | 100.0 /100 | #36 | Exceptional 53.1% |
| Immigrants | Denmark | 100.0 /100 | #37 | Exceptional 53.1% |
| Mongolians | 100.0 /100 | #38 | Exceptional 53.0% |
| Immigrants | Belarus | 99.9 /100 | #39 | Exceptional 52.8% |
| Immigrants | Latvia | 99.9 /100 | #40 | Exceptional 52.8% |
| Immigrants | Saudi Arabia | 99.9 /100 | #41 | Exceptional 52.6% |
| Immigrants | Malaysia | 99.9 /100 | #42 | Exceptional 52.5% |
| Immigrants | South Africa | 99.9 /100 | #43 | Exceptional 52.5% |
| Estonians | 99.9 /100 | #44 | Exceptional 52.5% |
| Immigrants | Lithuania | 99.9 /100 | #45 | Exceptional 52.4% |
| Immigrants | Bulgaria | 99.9 /100 | #46 | Exceptional 52.4% |
| Immigrants | Kuwait | 99.9 /100 | #47 | Exceptional 52.4% |
| Immigrants | Norway | 99.9 /100 | #48 | Exceptional 52.2% |
Demographics Similar to Native Hawaiians by Associate's Degree
In terms of associate's degree, the demographic groups most similar to Native Hawaiians are Tongan (43.0%, a difference of 0.16%), Tlingit-Haida (43.0%, a difference of 0.25%), Ecuadorian (43.0%, a difference of 0.35%), Immigrants from Barbados (43.3%, a difference of 0.43%), and Liberian (43.3%, a difference of 0.43%).
| Demographics | Rating | Rank | Associate's Degree |
| Guamanians/Chamorros | 4.8 /100 | #225 | Tragic 43.8% |
| Immigrants | Burma/Myanmar | 4.3 /100 | #226 | Tragic 43.7% |
| Trinidadians and Tobagonians | 4.0 /100 | #227 | Tragic 43.6% |
| Hmong | 3.2 /100 | #228 | Tragic 43.4% |
| Immigrants | Trinidad and Tobago | 3.0 /100 | #229 | Tragic 43.3% |
| Immigrants | Barbados | 2.9 /100 | #230 | Tragic 43.3% |
| Liberians | 2.9 /100 | #231 | Tragic 43.3% |
| Native Hawaiians | 2.3 /100 | #232 | Tragic 43.1% |
| Tongans | 2.2 /100 | #233 | Tragic 43.0% |
| Tlingit-Haida | 2.1 /100 | #234 | Tragic 43.0% |
| Ecuadorians | 2.0 /100 | #235 | Tragic 43.0% |
| Immigrants | St. Vincent and the Grenadines | 1.9 /100 | #236 | Tragic 42.9% |
| Immigrants | Nonimmigrants | 1.9 /100 | #237 | Tragic 42.9% |
| Iroquois | 1.7 /100 | #238 | Tragic 42.8% |
| Immigrants | Grenada | 1.3 /100 | #239 | Tragic 42.6% |