Immigrants from Micronesia vs Indian (Asian) Ambulatory Disability
COMPARE
Immigrants from Micronesia
Indian (Asian)
Ambulatory Disability
Ambulatory Disability Comparison
Immigrants from Micronesia
Indians (Asian)
7.0%
AMBULATORY DISABILITY
0.0/ 100
METRIC RATING
305th/ 347
METRIC RANK
5.4%
AMBULATORY DISABILITY
100.0/ 100
METRIC RATING
19th/ 347
METRIC RANK
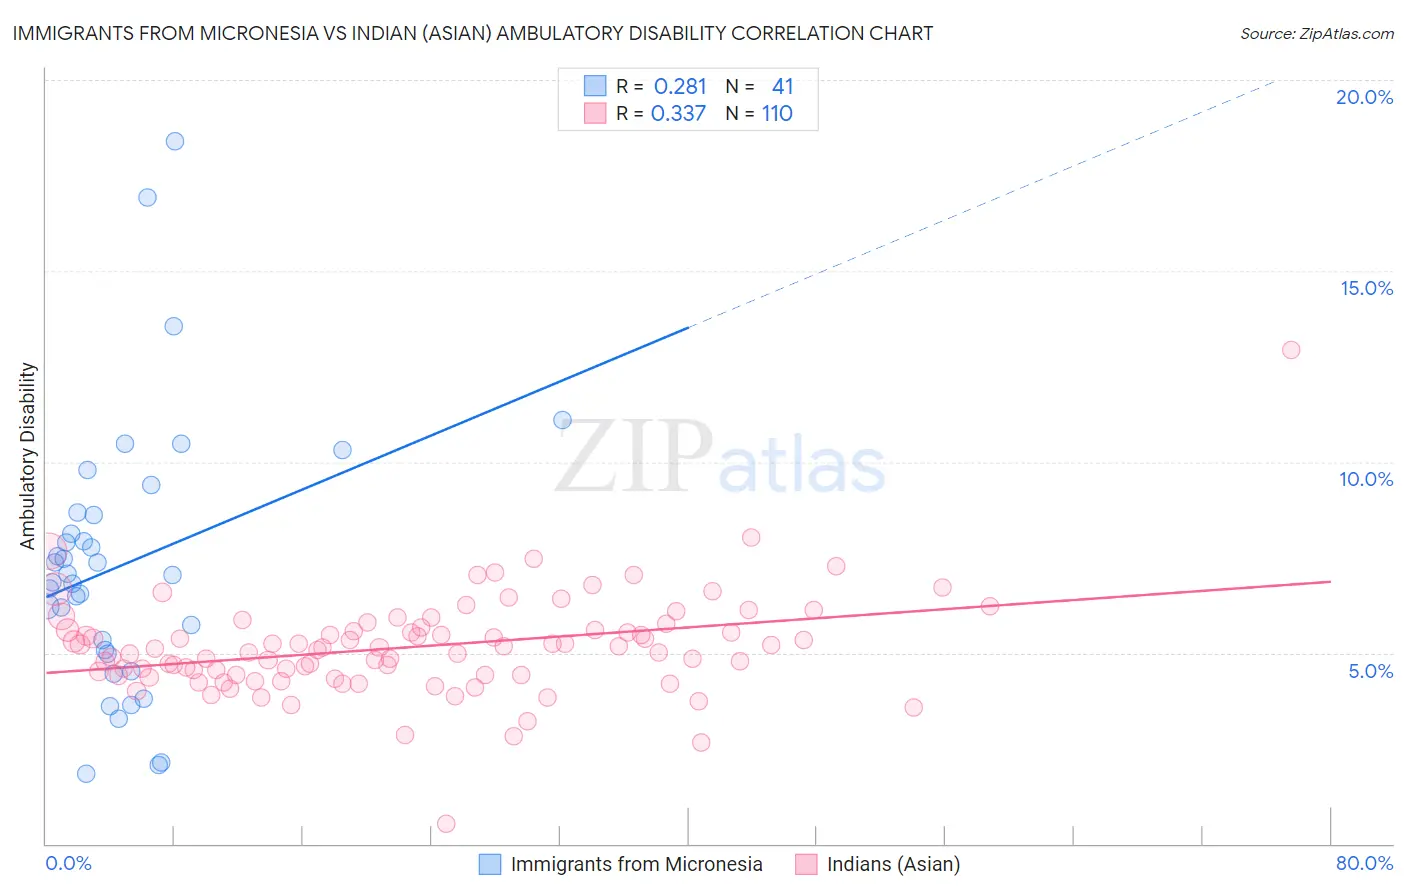
Immigrants from Micronesia vs Indian (Asian) Ambulatory Disability Correlation Chart
The statistical analysis conducted on geographies consisting of 61,585,357 people shows a weak positive correlation between the proportion of Immigrants from Micronesia and percentage of population with ambulatory disability in the United States with a correlation coefficient (R) of 0.281 and weighted average of 7.0%. Similarly, the statistical analysis conducted on geographies consisting of 495,002,853 people shows a mild positive correlation between the proportion of Indians (Asian) and percentage of population with ambulatory disability in the United States with a correlation coefficient (R) of 0.337 and weighted average of 5.4%, a difference of 30.8%.
Ambulatory Disability Correlation Summary
| Measurement | Immigrants from Micronesia | Indian (Asian) |
| Minimum | 1.8% | 0.51% |
| Maximum | 18.4% | 12.9% |
| Range | 16.6% | 12.4% |
| Mean | 7.3% | 5.2% |
| Median | 7.0% | 5.1% |
| Interquartile 25% (IQ1) | 5.0% | 4.4% |
| Interquartile 75% (IQ3) | 8.6% | 5.6% |
| Interquartile Range (IQR) | 3.6% | 1.2% |
| Standard Deviation (Sample) | 3.5% | 1.3% |
| Standard Deviation (Population) | 3.5% | 1.3% |
Similar Demographics by Ambulatory Disability
Demographics Similar to Immigrants from Micronesia by Ambulatory Disability
In terms of ambulatory disability, the demographic groups most similar to Immigrants from Micronesia are Immigrants from Cabo Verde (7.0%, a difference of 0.29%), Iroquois (7.1%, a difference of 0.53%), African (7.0%, a difference of 0.64%), Immigrants from Armenia (7.0%, a difference of 0.70%), and British West Indian (7.0%, a difference of 0.76%).
| Demographics | Rating | Rank | Ambulatory Disability |
| Immigrants | Grenada | 0.0 /100 | #298 | Tragic 6.9% |
| Puget Sound Salish | 0.0 /100 | #299 | Tragic 6.9% |
| Marshallese | 0.0 /100 | #300 | Tragic 6.9% |
| British West Indians | 0.0 /100 | #301 | Tragic 7.0% |
| Immigrants | Armenia | 0.0 /100 | #302 | Tragic 7.0% |
| Africans | 0.0 /100 | #303 | Tragic 7.0% |
| Immigrants | Cabo Verde | 0.0 /100 | #304 | Tragic 7.0% |
| Immigrants | Micronesia | 0.0 /100 | #305 | Tragic 7.0% |
| Iroquois | 0.0 /100 | #306 | Tragic 7.1% |
| Spanish Americans | 0.0 /100 | #307 | Tragic 7.1% |
| Chippewa | 0.0 /100 | #308 | Tragic 7.1% |
| Immigrants | Azores | 0.0 /100 | #309 | Tragic 7.1% |
| Arapaho | 0.0 /100 | #310 | Tragic 7.1% |
| Cree | 0.0 /100 | #311 | Tragic 7.1% |
| Delaware | 0.0 /100 | #312 | Tragic 7.1% |
Demographics Similar to Indians (Asian) by Ambulatory Disability
In terms of ambulatory disability, the demographic groups most similar to Indians (Asian) are Ethiopian (5.4%, a difference of 0.020%), Immigrants from Kuwait (5.4%, a difference of 0.020%), Immigrants from Sri Lanka (5.4%, a difference of 0.10%), Immigrants from Ethiopia (5.4%, a difference of 0.11%), and Immigrants from Israel (5.4%, a difference of 0.39%).
| Demographics | Rating | Rank | Ambulatory Disability |
| Okinawans | 100.0 /100 | #12 | Exceptional 5.3% |
| Burmese | 100.0 /100 | #13 | Exceptional 5.3% |
| Immigrants | Eastern Asia | 100.0 /100 | #14 | Exceptional 5.3% |
| Immigrants | China | 100.0 /100 | #15 | Exceptional 5.3% |
| Immigrants | Hong Kong | 100.0 /100 | #16 | Exceptional 5.3% |
| Immigrants | Ethiopia | 100.0 /100 | #17 | Exceptional 5.4% |
| Immigrants | Sri Lanka | 100.0 /100 | #18 | Exceptional 5.4% |
| Indians (Asian) | 100.0 /100 | #19 | Exceptional 5.4% |
| Ethiopians | 100.0 /100 | #20 | Exceptional 5.4% |
| Immigrants | Kuwait | 100.0 /100 | #21 | Exceptional 5.4% |
| Immigrants | Israel | 100.0 /100 | #22 | Exceptional 5.4% |
| Tongans | 100.0 /100 | #23 | Exceptional 5.4% |
| Immigrants | Saudi Arabia | 100.0 /100 | #24 | Exceptional 5.4% |
| Zimbabweans | 100.0 /100 | #25 | Exceptional 5.4% |
| Immigrants | Nepal | 100.0 /100 | #26 | Exceptional 5.4% |