Immigrants from Micronesia vs French Master's Degree
COMPARE
Immigrants from Micronesia
French
Master's Degree
Master's Degree Comparison
Immigrants from Micronesia
French
10.8%
MASTER'S DEGREE
0.0/ 100
METRIC RATING
320th/ 347
METRIC RANK
14.4%
MASTER'S DEGREE
23.7/ 100
METRIC RATING
204th/ 347
METRIC RANK
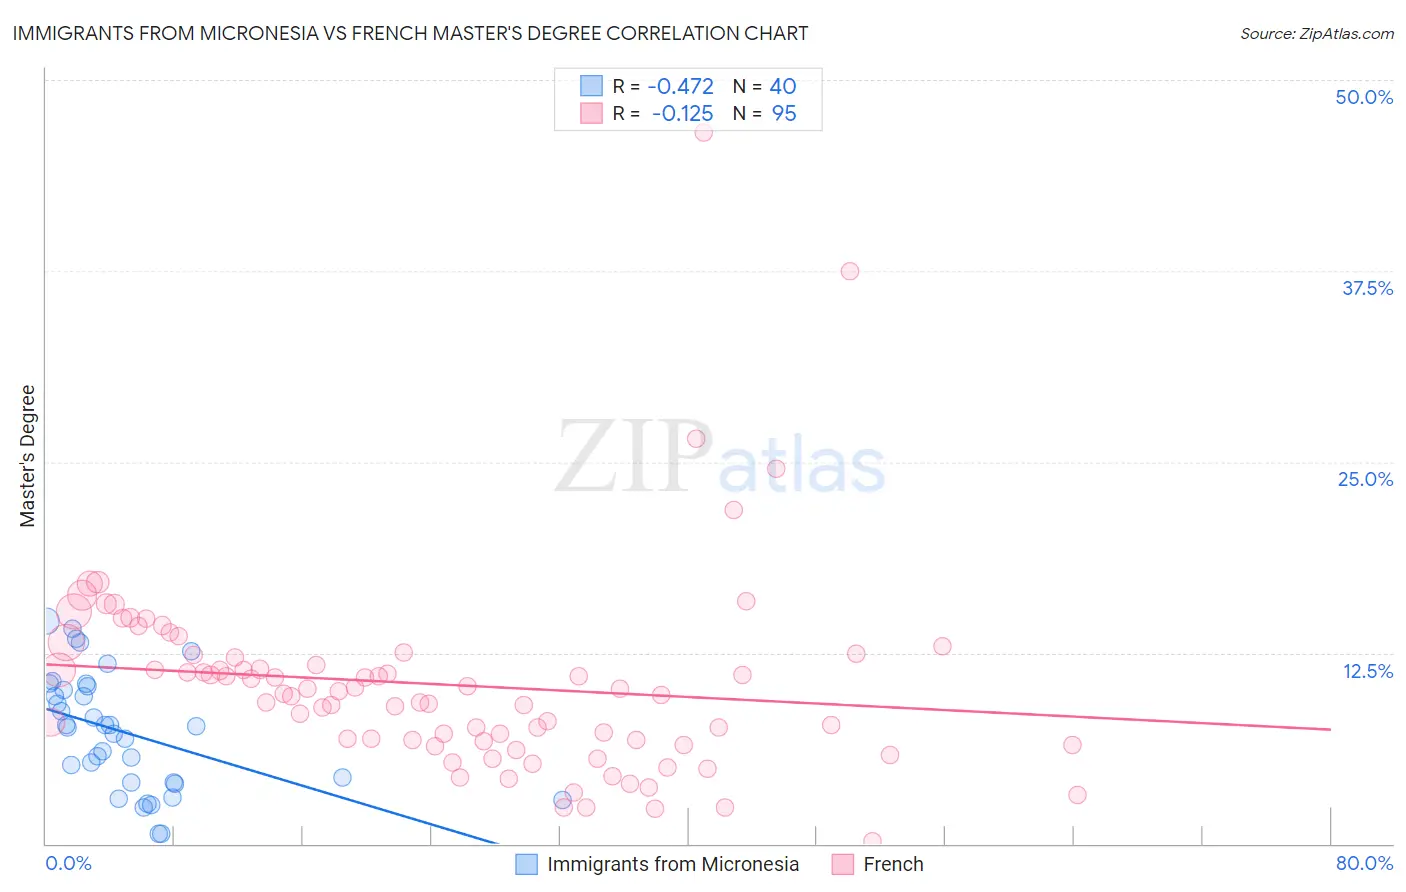
Immigrants from Micronesia vs French Master's Degree Correlation Chart
The statistical analysis conducted on geographies consisting of 61,602,639 people shows a moderate negative correlation between the proportion of Immigrants from Micronesia and percentage of population with at least master's degree education in the United States with a correlation coefficient (R) of -0.472 and weighted average of 10.8%. Similarly, the statistical analysis conducted on geographies consisting of 571,581,323 people shows a poor negative correlation between the proportion of French and percentage of population with at least master's degree education in the United States with a correlation coefficient (R) of -0.125 and weighted average of 14.4%, a difference of 33.4%.
Master's Degree Correlation Summary
| Measurement | Immigrants from Micronesia | French |
| Minimum | 0.67% | 0.20% |
| Maximum | 14.6% | 46.6% |
| Range | 13.9% | 46.4% |
| Mean | 7.3% | 10.4% |
| Median | 7.7% | 9.8% |
| Interquartile 25% (IQ1) | 4.0% | 6.7% |
| Interquartile 75% (IQ3) | 10.2% | 12.4% |
| Interquartile Range (IQR) | 6.1% | 5.7% |
| Standard Deviation (Sample) | 3.8% | 6.6% |
| Standard Deviation (Population) | 3.7% | 6.6% |
Similar Demographics by Master's Degree
Demographics Similar to Immigrants from Micronesia by Master's Degree
In terms of master's degree, the demographic groups most similar to Immigrants from Micronesia are Pennsylvania German (10.7%, a difference of 0.21%), Kiowa (10.8%, a difference of 0.62%), Sioux (10.7%, a difference of 0.85%), Immigrants from Cuba (10.9%, a difference of 0.86%), and Hopi (10.9%, a difference of 0.99%).
| Demographics | Rating | Rank | Master's Degree |
| Yaqui | 0.0 /100 | #313 | Tragic 11.0% |
| Cajuns | 0.0 /100 | #314 | Tragic 11.0% |
| Apache | 0.0 /100 | #315 | Tragic 11.0% |
| Hispanics or Latinos | 0.0 /100 | #316 | Tragic 10.9% |
| Hopi | 0.0 /100 | #317 | Tragic 10.9% |
| Immigrants | Cuba | 0.0 /100 | #318 | Tragic 10.9% |
| Kiowa | 0.0 /100 | #319 | Tragic 10.8% |
| Immigrants | Micronesia | 0.0 /100 | #320 | Tragic 10.8% |
| Pennsylvania Germans | 0.0 /100 | #321 | Tragic 10.7% |
| Sioux | 0.0 /100 | #322 | Tragic 10.7% |
| Crow | 0.0 /100 | #323 | Tragic 10.6% |
| Dutch West Indians | 0.0 /100 | #324 | Tragic 10.6% |
| Inupiat | 0.0 /100 | #325 | Tragic 10.5% |
| Creek | 0.0 /100 | #326 | Tragic 10.5% |
| Paiute | 0.0 /100 | #327 | Tragic 10.5% |
Demographics Similar to French by Master's Degree
In terms of master's degree, the demographic groups most similar to French are Trinidadian and Tobagonian (14.4%, a difference of 0.030%), Scandinavian (14.4%, a difference of 0.070%), Yugoslavian (14.4%, a difference of 0.11%), Immigrants from Western Africa (14.4%, a difference of 0.22%), and Scotch-Irish (14.4%, a difference of 0.24%).
| Demographics | Rating | Rank | Master's Degree |
| Belgians | 28.0 /100 | #197 | Fair 14.5% |
| West Indians | 27.4 /100 | #198 | Fair 14.5% |
| Immigrants | Armenia | 27.2 /100 | #199 | Fair 14.5% |
| Panamanians | 25.1 /100 | #200 | Fair 14.4% |
| Scotch-Irish | 25.0 /100 | #201 | Fair 14.4% |
| Immigrants | Western Africa | 24.9 /100 | #202 | Fair 14.4% |
| Yugoslavians | 24.3 /100 | #203 | Fair 14.4% |
| French | 23.7 /100 | #204 | Fair 14.4% |
| Trinidadians and Tobagonians | 23.5 /100 | #205 | Fair 14.4% |
| Scandinavians | 23.3 /100 | #206 | Fair 14.4% |
| Immigrants | Bosnia and Herzegovina | 22.0 /100 | #207 | Fair 14.3% |
| Immigrants | Barbados | 20.5 /100 | #208 | Fair 14.3% |
| Immigrants | Panama | 20.0 /100 | #209 | Fair 14.3% |
| Sub-Saharan Africans | 19.4 /100 | #210 | Poor 14.2% |
| Somalis | 18.0 /100 | #211 | Poor 14.2% |