Immigrants from Micronesia vs Uruguayan Master's Degree
COMPARE
Immigrants from Micronesia
Uruguayan
Master's Degree
Master's Degree Comparison
Immigrants from Micronesia
Uruguayans
10.8%
MASTER'S DEGREE
0.0/ 100
METRIC RATING
320th/ 347
METRIC RANK
15.3%
MASTER'S DEGREE
67.1/ 100
METRIC RATING
163rd/ 347
METRIC RANK
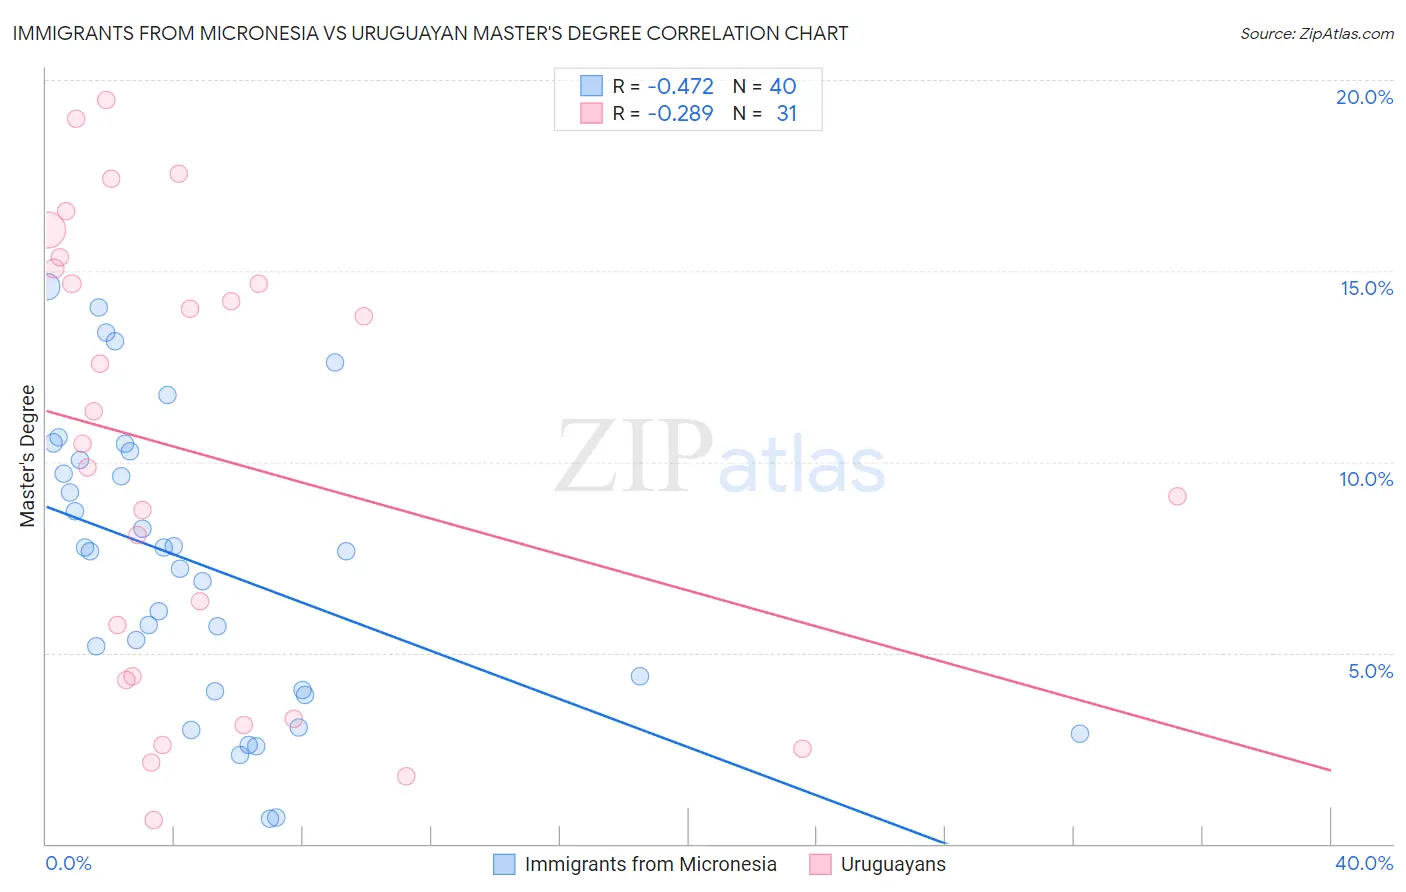
Immigrants from Micronesia vs Uruguayan Master's Degree Correlation Chart
The statistical analysis conducted on geographies consisting of 61,602,639 people shows a moderate negative correlation between the proportion of Immigrants from Micronesia and percentage of population with at least master's degree education in the United States with a correlation coefficient (R) of -0.472 and weighted average of 10.8%. Similarly, the statistical analysis conducted on geographies consisting of 144,768,482 people shows a weak negative correlation between the proportion of Uruguayans and percentage of population with at least master's degree education in the United States with a correlation coefficient (R) of -0.289 and weighted average of 15.3%, a difference of 41.8%.
Master's Degree Correlation Summary
| Measurement | Immigrants from Micronesia | Uruguayan |
| Minimum | 0.67% | 0.62% |
| Maximum | 14.6% | 19.5% |
| Range | 13.9% | 18.8% |
| Mean | 7.3% | 10.2% |
| Median | 7.7% | 10.5% |
| Interquartile 25% (IQ1) | 4.0% | 4.3% |
| Interquartile 75% (IQ3) | 10.2% | 15.1% |
| Interquartile Range (IQR) | 6.1% | 10.8% |
| Standard Deviation (Sample) | 3.8% | 5.9% |
| Standard Deviation (Population) | 3.7% | 5.8% |
Similar Demographics by Master's Degree
Demographics Similar to Immigrants from Micronesia by Master's Degree
In terms of master's degree, the demographic groups most similar to Immigrants from Micronesia are Pennsylvania German (10.7%, a difference of 0.21%), Kiowa (10.8%, a difference of 0.62%), Sioux (10.7%, a difference of 0.85%), Immigrants from Cuba (10.9%, a difference of 0.86%), and Hopi (10.9%, a difference of 0.99%).
| Demographics | Rating | Rank | Master's Degree |
| Yaqui | 0.0 /100 | #313 | Tragic 11.0% |
| Cajuns | 0.0 /100 | #314 | Tragic 11.0% |
| Apache | 0.0 /100 | #315 | Tragic 11.0% |
| Hispanics or Latinos | 0.0 /100 | #316 | Tragic 10.9% |
| Hopi | 0.0 /100 | #317 | Tragic 10.9% |
| Immigrants | Cuba | 0.0 /100 | #318 | Tragic 10.9% |
| Kiowa | 0.0 /100 | #319 | Tragic 10.8% |
| Immigrants | Micronesia | 0.0 /100 | #320 | Tragic 10.8% |
| Pennsylvania Germans | 0.0 /100 | #321 | Tragic 10.7% |
| Sioux | 0.0 /100 | #322 | Tragic 10.7% |
| Crow | 0.0 /100 | #323 | Tragic 10.6% |
| Dutch West Indians | 0.0 /100 | #324 | Tragic 10.6% |
| Inupiat | 0.0 /100 | #325 | Tragic 10.5% |
| Creek | 0.0 /100 | #326 | Tragic 10.5% |
| Paiute | 0.0 /100 | #327 | Tragic 10.5% |
Demographics Similar to Uruguayans by Master's Degree
In terms of master's degree, the demographic groups most similar to Uruguayans are Colombian (15.3%, a difference of 0.030%), Immigrants from Kenya (15.3%, a difference of 0.070%), Swedish (15.2%, a difference of 0.14%), Senegalese (15.2%, a difference of 0.21%), and Peruvian (15.3%, a difference of 0.22%).
| Demographics | Rating | Rank | Master's Degree |
| Bermudans | 73.9 /100 | #156 | Good 15.4% |
| Immigrants | Cameroon | 71.7 /100 | #157 | Good 15.4% |
| Immigrants | Poland | 71.5 /100 | #158 | Good 15.4% |
| Luxembourgers | 71.0 /100 | #159 | Good 15.3% |
| Kenyans | 70.3 /100 | #160 | Good 15.3% |
| Sudanese | 68.7 /100 | #161 | Good 15.3% |
| Peruvians | 68.7 /100 | #162 | Good 15.3% |
| Uruguayans | 67.1 /100 | #163 | Good 15.3% |
| Colombians | 66.9 /100 | #164 | Good 15.3% |
| Immigrants | Kenya | 66.6 /100 | #165 | Good 15.3% |
| Swedes | 66.1 /100 | #166 | Good 15.2% |
| Senegalese | 65.6 /100 | #167 | Good 15.2% |
| Immigrants | North Macedonia | 64.5 /100 | #168 | Good 15.2% |
| Scottish | 62.7 /100 | #169 | Good 15.2% |
| Irish | 56.3 /100 | #170 | Average 15.0% |