Immigrants from Haiti vs Belizean 12th Grade, No Diploma
COMPARE
Immigrants from Haiti
Belizean
12th Grade, No Diploma
12th Grade, No Diploma Comparison
Immigrants from Haiti
Belizeans
88.2%
12TH GRADE, NO DIPLOMA
0.0/ 100
METRIC RATING
298th/ 347
METRIC RANK
87.0%
12TH GRADE, NO DIPLOMA
0.0/ 100
METRIC RATING
318th/ 347
METRIC RANK
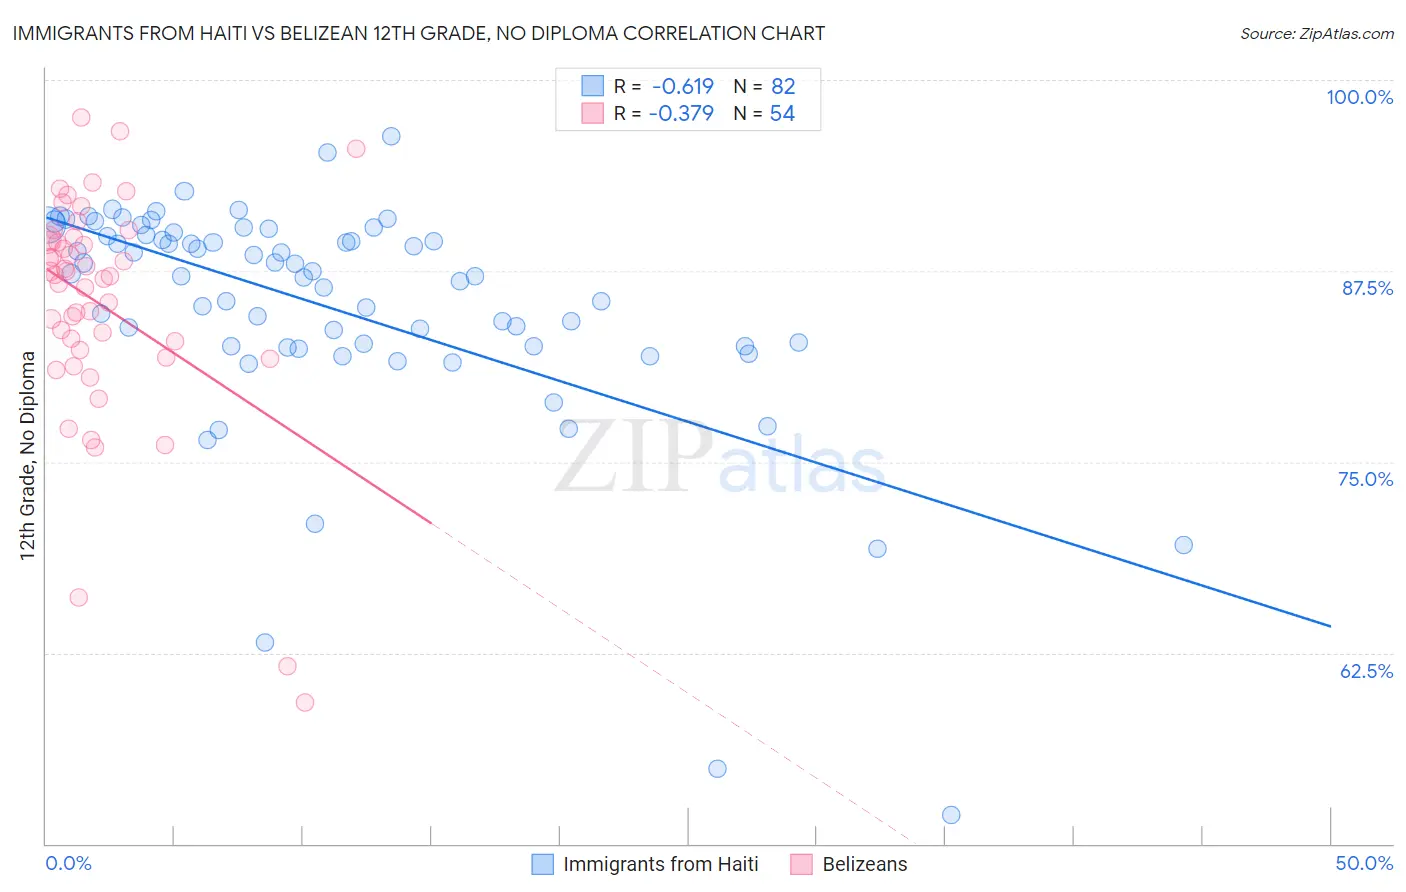
Immigrants from Haiti vs Belizean 12th Grade, No Diploma Correlation Chart
The statistical analysis conducted on geographies consisting of 225,286,636 people shows a significant negative correlation between the proportion of Immigrants from Haiti and percentage of population with at least 12th grade (no diploma) education in the United States with a correlation coefficient (R) of -0.619 and weighted average of 88.2%. Similarly, the statistical analysis conducted on geographies consisting of 144,225,006 people shows a mild negative correlation between the proportion of Belizeans and percentage of population with at least 12th grade (no diploma) education in the United States with a correlation coefficient (R) of -0.379 and weighted average of 87.0%, a difference of 1.3%.
12th Grade, No Diploma Correlation Summary
| Measurement | Immigrants from Haiti | Belizean |
| Minimum | 51.9% | 59.3% |
| Maximum | 96.4% | 97.5% |
| Range | 44.4% | 38.2% |
| Mean | 85.1% | 85.3% |
| Median | 87.2% | 87.2% |
| Interquartile 25% (IQ1) | 82.6% | 82.3% |
| Interquartile 75% (IQ3) | 89.9% | 89.5% |
| Interquartile Range (IQR) | 7.3% | 7.2% |
| Standard Deviation (Sample) | 7.7% | 7.5% |
| Standard Deviation (Population) | 7.6% | 7.5% |
Demographics Similar to Immigrants from Haiti and Belizeans by 12th Grade, No Diploma
In terms of 12th grade, no diploma, the demographic groups most similar to Immigrants from Haiti are Nepalese (88.1%, a difference of 0.040%), Immigrants from Guyana (88.1%, a difference of 0.090%), Immigrants from Cambodia (88.1%, a difference of 0.090%), Ecuadorian (88.0%, a difference of 0.12%), and Immigrants from Bangladesh (88.0%, a difference of 0.22%). Similarly, the demographic groups most similar to Belizeans are Navajo (87.1%, a difference of 0.060%), Apache (87.3%, a difference of 0.35%), Nicaraguan (87.3%, a difference of 0.36%), Cape Verdean (87.4%, a difference of 0.40%), and Immigrants from Caribbean (87.4%, a difference of 0.41%).
| Demographics | Rating | Rank | 12th Grade, No Diploma |
| Immigrants | Haiti | 0.0 /100 | #298 | Tragic 88.2% |
| Nepalese | 0.0 /100 | #299 | Tragic 88.1% |
| Immigrants | Guyana | 0.0 /100 | #300 | Tragic 88.1% |
| Immigrants | Cambodia | 0.0 /100 | #301 | Tragic 88.1% |
| Ecuadorians | 0.0 /100 | #302 | Tragic 88.0% |
| Immigrants | Bangladesh | 0.0 /100 | #303 | Tragic 88.0% |
| Vietnamese | 0.0 /100 | #304 | Tragic 87.9% |
| Immigrants | Dominica | 0.0 /100 | #305 | Tragic 87.7% |
| Natives/Alaskans | 0.0 /100 | #306 | Tragic 87.7% |
| Immigrants | Portugal | 0.0 /100 | #307 | Tragic 87.6% |
| Yup'ik | 0.0 /100 | #308 | Tragic 87.6% |
| Immigrants | Armenia | 0.0 /100 | #309 | Tragic 87.6% |
| Immigrants | Cuba | 0.0 /100 | #310 | Tragic 87.5% |
| Yaqui | 0.0 /100 | #311 | Tragic 87.5% |
| Immigrants | Ecuador | 0.0 /100 | #312 | Tragic 87.5% |
| Immigrants | Caribbean | 0.0 /100 | #313 | Tragic 87.4% |
| Cape Verdeans | 0.0 /100 | #314 | Tragic 87.4% |
| Nicaraguans | 0.0 /100 | #315 | Tragic 87.3% |
| Apache | 0.0 /100 | #316 | Tragic 87.3% |
| Navajo | 0.0 /100 | #317 | Tragic 87.1% |
| Belizeans | 0.0 /100 | #318 | Tragic 87.0% |