Immigrants from Mexico vs Trinidadian and Tobagonian 1st Grade
COMPARE
Immigrants from Mexico
Trinidadian and Tobagonian
1st Grade
1st Grade Comparison
Immigrants from Mexico
Trinidadians and Tobagonians
96.3%
1ST GRADE
0.0/ 100
METRIC RATING
342nd/ 347
METRIC RANK
97.3%
1ST GRADE
0.1/ 100
METRIC RATING
281st/ 347
METRIC RANK
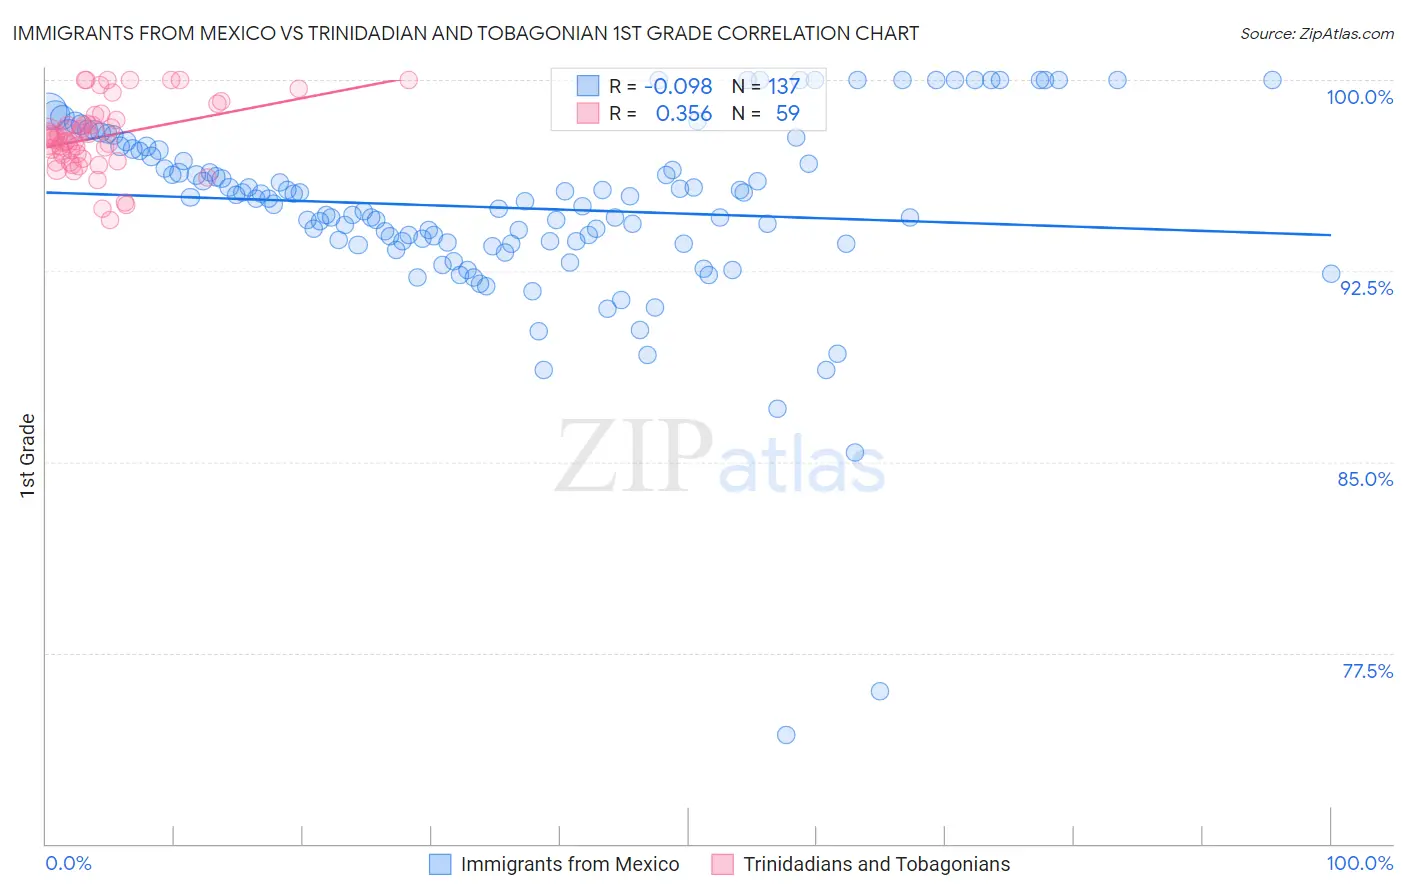
Immigrants from Mexico vs Trinidadian and Tobagonian 1st Grade Correlation Chart
The statistical analysis conducted on geographies consisting of 513,767,418 people shows a slight negative correlation between the proportion of Immigrants from Mexico and percentage of population with at least 1st grade education in the United States with a correlation coefficient (R) of -0.098 and weighted average of 96.3%. Similarly, the statistical analysis conducted on geographies consisting of 219,882,819 people shows a mild positive correlation between the proportion of Trinidadians and Tobagonians and percentage of population with at least 1st grade education in the United States with a correlation coefficient (R) of 0.356 and weighted average of 97.3%, a difference of 1.1%.
1st Grade Correlation Summary
| Measurement | Immigrants from Mexico | Trinidadian and Tobagonian |
| Minimum | 74.3% | 94.5% |
| Maximum | 100.0% | 100.0% |
| Range | 25.7% | 5.5% |
| Mean | 95.0% | 97.8% |
| Median | 95.3% | 97.8% |
| Interquartile 25% (IQ1) | 93.6% | 96.9% |
| Interquartile 75% (IQ3) | 97.3% | 98.4% |
| Interquartile Range (IQR) | 3.7% | 1.5% |
| Standard Deviation (Sample) | 3.8% | 1.3% |
| Standard Deviation (Population) | 3.8% | 1.3% |
Similar Demographics by 1st Grade
Demographics Similar to Immigrants from Mexico by 1st Grade
In terms of 1st grade, the demographic groups most similar to Immigrants from Mexico are Immigrants from Central America (96.3%, a difference of 0.030%), Salvadoran (96.3%, a difference of 0.030%), Immigrants from Cabo Verde (96.3%, a difference of 0.050%), Immigrants from Guatemala (96.4%, a difference of 0.070%), and Immigrants from Fiji (96.4%, a difference of 0.14%).
| Demographics | Rating | Rank | 1st Grade |
| Immigrants | Dominican Republic | 0.0 /100 | #333 | Tragic 96.5% |
| Bangladeshis | 0.0 /100 | #334 | Tragic 96.5% |
| Yakama | 0.0 /100 | #335 | Tragic 96.5% |
| Guatemalans | 0.0 /100 | #336 | Tragic 96.5% |
| Immigrants | Cambodia | 0.0 /100 | #337 | Tragic 96.5% |
| Immigrants | Fiji | 0.0 /100 | #338 | Tragic 96.4% |
| Immigrants | Guatemala | 0.0 /100 | #339 | Tragic 96.4% |
| Immigrants | Cabo Verde | 0.0 /100 | #340 | Tragic 96.3% |
| Immigrants | Central America | 0.0 /100 | #341 | Tragic 96.3% |
| Immigrants | Mexico | 0.0 /100 | #342 | Tragic 96.3% |
| Salvadorans | 0.0 /100 | #343 | Tragic 96.3% |
| Nepalese | 0.0 /100 | #344 | Tragic 96.1% |
| Immigrants | El Salvador | 0.0 /100 | #345 | Tragic 96.1% |
| Immigrants | Yemen | 0.0 /100 | #346 | Tragic 95.8% |
| Spanish American Indians | 0.0 /100 | #347 | Tragic 95.7% |
Demographics Similar to Trinidadians and Tobagonians by 1st Grade
In terms of 1st grade, the demographic groups most similar to Trinidadians and Tobagonians are Afghan (97.4%, a difference of 0.0%), Barbadian (97.3%, a difference of 0.0%), Immigrants from Uzbekistan (97.4%, a difference of 0.010%), Immigrants from Ghana (97.4%, a difference of 0.010%), and Immigrants from Western Africa (97.4%, a difference of 0.030%).
| Demographics | Rating | Rank | 1st Grade |
| Ghanaians | 0.1 /100 | #274 | Tragic 97.4% |
| Immigrants | China | 0.1 /100 | #275 | Tragic 97.4% |
| Immigrants | Philippines | 0.1 /100 | #276 | Tragic 97.4% |
| Immigrants | Western Africa | 0.1 /100 | #277 | Tragic 97.4% |
| Immigrants | Uzbekistan | 0.1 /100 | #278 | Tragic 97.4% |
| Immigrants | Ghana | 0.1 /100 | #279 | Tragic 97.4% |
| Afghans | 0.1 /100 | #280 | Tragic 97.4% |
| Trinidadians and Tobagonians | 0.1 /100 | #281 | Tragic 97.3% |
| Barbadians | 0.1 /100 | #282 | Tragic 97.3% |
| Immigrants | West Indies | 0.0 /100 | #283 | Tragic 97.3% |
| Immigrants | Trinidad and Tobago | 0.0 /100 | #284 | Tragic 97.3% |
| Immigrants | Portugal | 0.0 /100 | #285 | Tragic 97.3% |
| Immigrants | Barbados | 0.0 /100 | #286 | Tragic 97.3% |
| Immigrants | Hong Kong | 0.0 /100 | #287 | Tragic 97.3% |
| Immigrants | Thailand | 0.0 /100 | #288 | Tragic 97.3% |