Immigrants from Mexico vs Immigrants from St. Vincent and the Grenadines 5th Grade
COMPARE
Immigrants from Mexico
Immigrants from St. Vincent and the Grenadines
5th Grade
5th Grade Comparison
Immigrants from Mexico
Immigrants from St. Vincent and the Grenadines
94.6%
5TH GRADE
0.0/ 100
METRIC RATING
344th/ 347
METRIC RANK
96.6%
5TH GRADE
0.1/ 100
METRIC RATING
285th/ 347
METRIC RANK
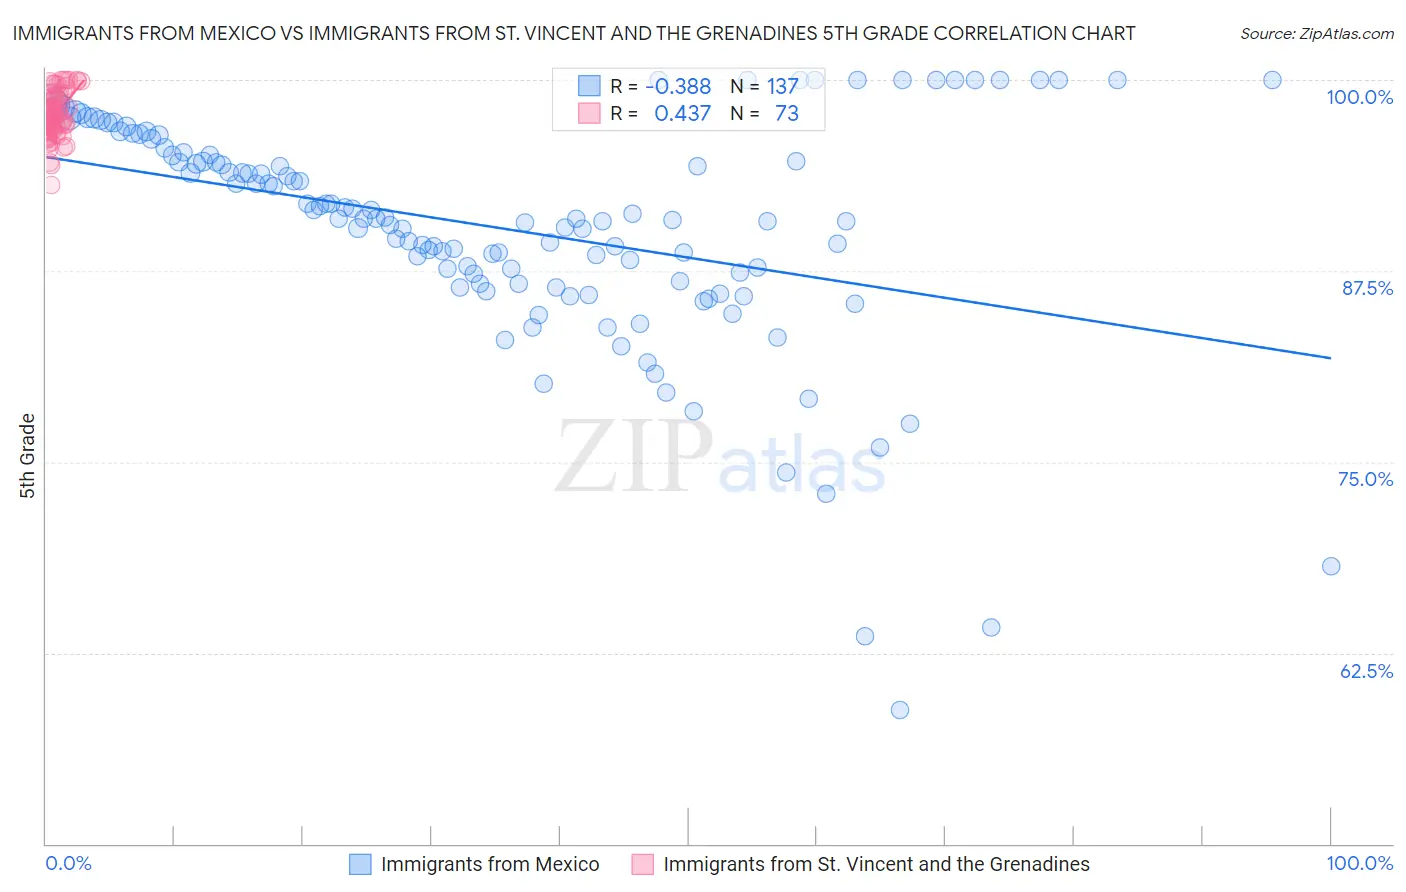
Immigrants from Mexico vs Immigrants from St. Vincent and the Grenadines 5th Grade Correlation Chart
The statistical analysis conducted on geographies consisting of 513,767,628 people shows a mild negative correlation between the proportion of Immigrants from Mexico and percentage of population with at least 5th grade education in the United States with a correlation coefficient (R) of -0.388 and weighted average of 94.6%. Similarly, the statistical analysis conducted on geographies consisting of 56,191,418 people shows a moderate positive correlation between the proportion of Immigrants from St. Vincent and the Grenadines and percentage of population with at least 5th grade education in the United States with a correlation coefficient (R) of 0.437 and weighted average of 96.6%, a difference of 2.1%.
5th Grade Correlation Summary
| Measurement | Immigrants from Mexico | Immigrants from St. Vincent and the Grenadines |
| Minimum | 58.8% | 93.1% |
| Maximum | 100.0% | 100.0% |
| Range | 41.2% | 6.9% |
| Mean | 90.3% | 97.7% |
| Median | 90.9% | 97.6% |
| Interquartile 25% (IQ1) | 86.8% | 96.7% |
| Interquartile 75% (IQ3) | 95.2% | 98.8% |
| Interquartile Range (IQR) | 8.4% | 2.0% |
| Standard Deviation (Sample) | 7.5% | 1.5% |
| Standard Deviation (Population) | 7.5% | 1.5% |
Similar Demographics by 5th Grade
Demographics Similar to Immigrants from Mexico by 5th Grade
In terms of 5th grade, the demographic groups most similar to Immigrants from Mexico are Salvadoran (94.6%, a difference of 0.0%), Immigrants from Guatemala (94.6%, a difference of 0.010%), Immigrants from Central America (94.7%, a difference of 0.060%), Yakama (94.8%, a difference of 0.16%), and Guatemalan (94.8%, a difference of 0.24%).
| Demographics | Rating | Rank | 5th Grade |
| Immigrants | Latin America | 0.0 /100 | #333 | Tragic 95.3% |
| Nepalese | 0.0 /100 | #334 | Tragic 95.2% |
| Mexicans | 0.0 /100 | #335 | Tragic 95.2% |
| Immigrants | Azores | 0.0 /100 | #336 | Tragic 95.1% |
| Central Americans | 0.0 /100 | #337 | Tragic 95.1% |
| Immigrants | Cabo Verde | 0.0 /100 | #338 | Tragic 94.9% |
| Immigrants | Yemen | 0.0 /100 | #339 | Tragic 94.9% |
| Guatemalans | 0.0 /100 | #340 | Tragic 94.8% |
| Yakama | 0.0 /100 | #341 | Tragic 94.8% |
| Immigrants | Central America | 0.0 /100 | #342 | Tragic 94.7% |
| Salvadorans | 0.0 /100 | #343 | Tragic 94.6% |
| Immigrants | Mexico | 0.0 /100 | #344 | Tragic 94.6% |
| Immigrants | Guatemala | 0.0 /100 | #345 | Tragic 94.6% |
| Immigrants | El Salvador | 0.0 /100 | #346 | Tragic 94.3% |
| Spanish American Indians | 0.0 /100 | #347 | Tragic 94.2% |
Demographics Similar to Immigrants from St. Vincent and the Grenadines by 5th Grade
In terms of 5th grade, the demographic groups most similar to Immigrants from St. Vincent and the Grenadines are Immigrants from Thailand (96.6%, a difference of 0.0%), Immigrants from Trinidad and Tobago (96.6%, a difference of 0.010%), Immigrants from Western Africa (96.6%, a difference of 0.020%), Houma (96.6%, a difference of 0.020%), and Barbadian (96.6%, a difference of 0.020%).
| Demographics | Rating | Rank | 5th Grade |
| Immigrants | Ghana | 0.1 /100 | #278 | Tragic 96.6% |
| Immigrants | Philippines | 0.1 /100 | #279 | Tragic 96.6% |
| Immigrants | Western Africa | 0.1 /100 | #280 | Tragic 96.6% |
| Houma | 0.1 /100 | #281 | Tragic 96.6% |
| Barbadians | 0.1 /100 | #282 | Tragic 96.6% |
| Fijians | 0.1 /100 | #283 | Tragic 96.6% |
| Immigrants | Trinidad and Tobago | 0.1 /100 | #284 | Tragic 96.6% |
| Immigrants | St. Vincent and the Grenadines | 0.1 /100 | #285 | Tragic 96.6% |
| Immigrants | Thailand | 0.1 /100 | #286 | Tragic 96.6% |
| Immigrants | Afghanistan | 0.1 /100 | #287 | Tragic 96.6% |
| Immigrants | Barbados | 0.0 /100 | #288 | Tragic 96.6% |
| Immigrants | West Indies | 0.0 /100 | #289 | Tragic 96.5% |
| British West Indians | 0.0 /100 | #290 | Tragic 96.5% |
| Malaysians | 0.0 /100 | #291 | Tragic 96.5% |
| Somalis | 0.0 /100 | #292 | Tragic 96.5% |