Immigrants from Mexico vs Puerto Rican Associate's Degree
COMPARE
Immigrants from Mexico
Puerto Rican
Associate's Degree
Associate's Degree Comparison
Immigrants from Mexico
Puerto Ricans
33.7%
ASSOCIATE'S DEGREE
0.0/ 100
METRIC RATING
339th/ 347
METRIC RANK
40.4%
ASSOCIATE'S DEGREE
0.1/ 100
METRIC RATING
276th/ 347
METRIC RANK
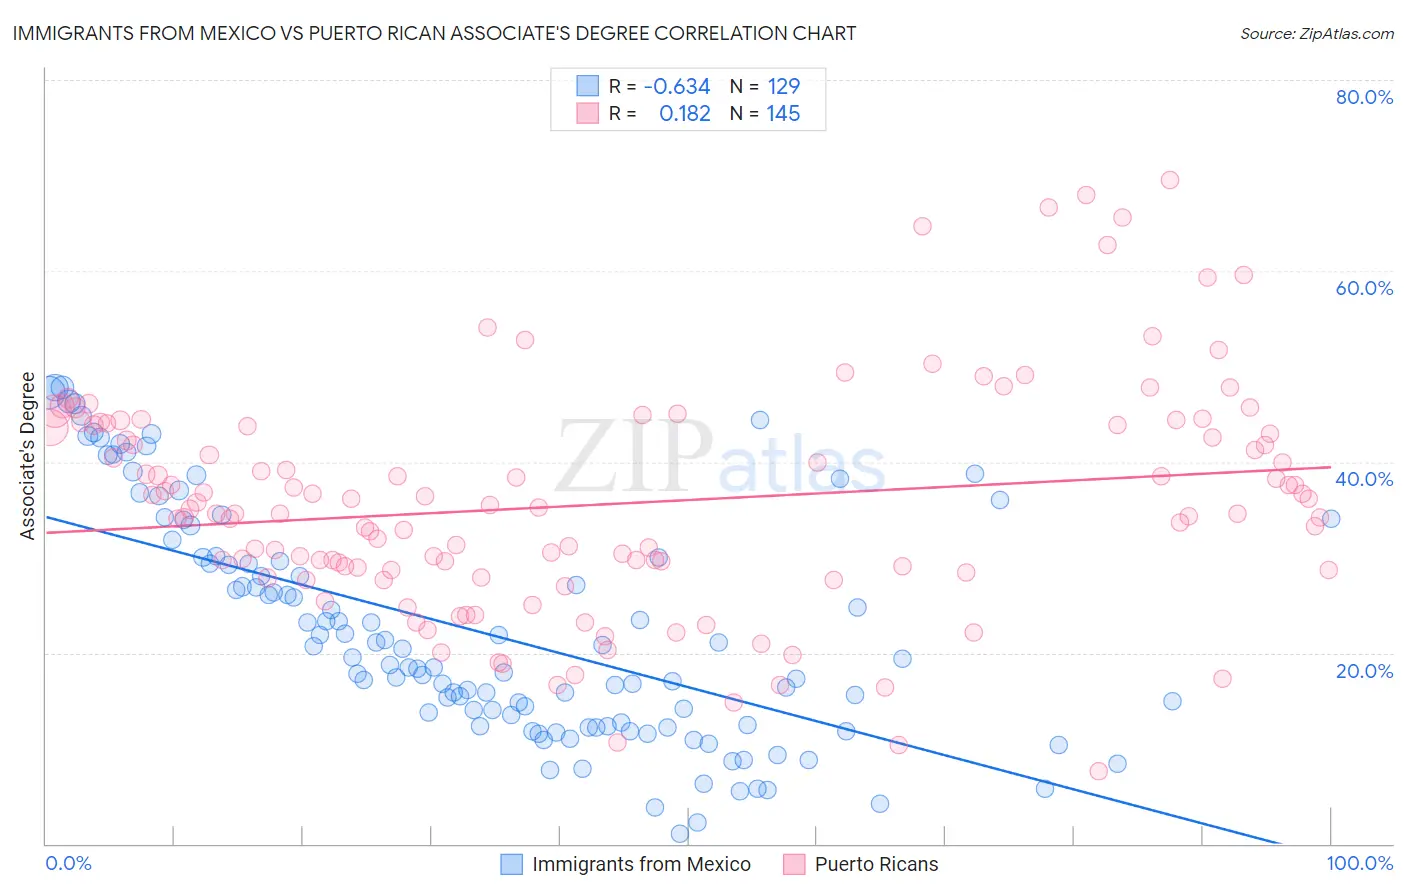
Immigrants from Mexico vs Puerto Rican Associate's Degree Correlation Chart
The statistical analysis conducted on geographies consisting of 513,696,762 people shows a significant negative correlation between the proportion of Immigrants from Mexico and percentage of population with at least associate's degree education in the United States with a correlation coefficient (R) of -0.634 and weighted average of 33.7%. Similarly, the statistical analysis conducted on geographies consisting of 528,257,777 people shows a poor positive correlation between the proportion of Puerto Ricans and percentage of population with at least associate's degree education in the United States with a correlation coefficient (R) of 0.182 and weighted average of 40.4%, a difference of 19.7%.
Associate's Degree Correlation Summary
| Measurement | Immigrants from Mexico | Puerto Rican |
| Minimum | 0.99% | 7.5% |
| Maximum | 47.9% | 69.5% |
| Range | 46.9% | 61.9% |
| Mean | 22.3% | 35.6% |
| Median | 19.4% | 34.6% |
| Interquartile 25% (IQ1) | 12.4% | 28.7% |
| Interquartile 75% (IQ3) | 30.0% | 43.8% |
| Interquartile Range (IQR) | 17.6% | 15.1% |
| Standard Deviation (Sample) | 12.0% | 11.8% |
| Standard Deviation (Population) | 11.9% | 11.8% |
Similar Demographics by Associate's Degree
Demographics Similar to Immigrants from Mexico by Associate's Degree
In terms of associate's degree, the demographic groups most similar to Immigrants from Mexico are Pueblo (34.0%, a difference of 0.71%), Lumbee (34.1%, a difference of 1.1%), Hopi (34.6%, a difference of 2.4%), Spanish American Indian (34.9%, a difference of 3.3%), and Native/Alaskan (34.9%, a difference of 3.5%).
| Demographics | Rating | Rank | Associate's Degree |
| Immigrants | Central America | 0.0 /100 | #332 | Tragic 35.0% |
| Mexicans | 0.0 /100 | #333 | Tragic 35.0% |
| Natives/Alaskans | 0.0 /100 | #334 | Tragic 34.9% |
| Spanish American Indians | 0.0 /100 | #335 | Tragic 34.9% |
| Hopi | 0.0 /100 | #336 | Tragic 34.6% |
| Lumbee | 0.0 /100 | #337 | Tragic 34.1% |
| Pueblo | 0.0 /100 | #338 | Tragic 34.0% |
| Immigrants | Mexico | 0.0 /100 | #339 | Tragic 33.7% |
| Navajo | 0.0 /100 | #340 | Tragic 32.6% |
| Inupiat | 0.0 /100 | #341 | Tragic 32.6% |
| Yakama | 0.0 /100 | #342 | Tragic 32.3% |
| Tohono O'odham | 0.0 /100 | #343 | Tragic 31.8% |
| Yuman | 0.0 /100 | #344 | Tragic 31.3% |
| Pima | 0.0 /100 | #345 | Tragic 30.2% |
| Houma | 0.0 /100 | #346 | Tragic 28.2% |
Demographics Similar to Puerto Ricans by Associate's Degree
In terms of associate's degree, the demographic groups most similar to Puerto Ricans are Blackfeet (40.3%, a difference of 0.050%), Potawatomi (40.4%, a difference of 0.10%), Ottawa (40.3%, a difference of 0.20%), Immigrants from Nicaragua (40.3%, a difference of 0.24%), and Immigrants from Dominica (40.5%, a difference of 0.25%).
| Demographics | Rating | Rank | Associate's Degree |
| Americans | 0.2 /100 | #269 | Tragic 40.8% |
| Chippewa | 0.2 /100 | #270 | Tragic 40.7% |
| Immigrants | Laos | 0.1 /100 | #271 | Tragic 40.7% |
| Belizeans | 0.1 /100 | #272 | Tragic 40.6% |
| Puget Sound Salish | 0.1 /100 | #273 | Tragic 40.5% |
| Immigrants | Dominica | 0.1 /100 | #274 | Tragic 40.5% |
| Potawatomi | 0.1 /100 | #275 | Tragic 40.4% |
| Puerto Ricans | 0.1 /100 | #276 | Tragic 40.4% |
| Blackfeet | 0.1 /100 | #277 | Tragic 40.3% |
| Ottawa | 0.1 /100 | #278 | Tragic 40.3% |
| Immigrants | Nicaragua | 0.1 /100 | #279 | Tragic 40.3% |
| Immigrants | Micronesia | 0.1 /100 | #280 | Tragic 40.2% |
| Immigrants | Portugal | 0.1 /100 | #281 | Tragic 40.1% |
| Bangladeshis | 0.1 /100 | #282 | Tragic 40.0% |
| Haitians | 0.1 /100 | #283 | Tragic 40.0% |