Immigrants from Mexico vs Tongan Associate's Degree
COMPARE
Immigrants from Mexico
Tongan
Associate's Degree
Associate's Degree Comparison
Immigrants from Mexico
Tongans
33.7%
ASSOCIATE'S DEGREE
0.0/ 100
METRIC RATING
339th/ 347
METRIC RANK
43.0%
ASSOCIATE'S DEGREE
2.2/ 100
METRIC RATING
233rd/ 347
METRIC RANK
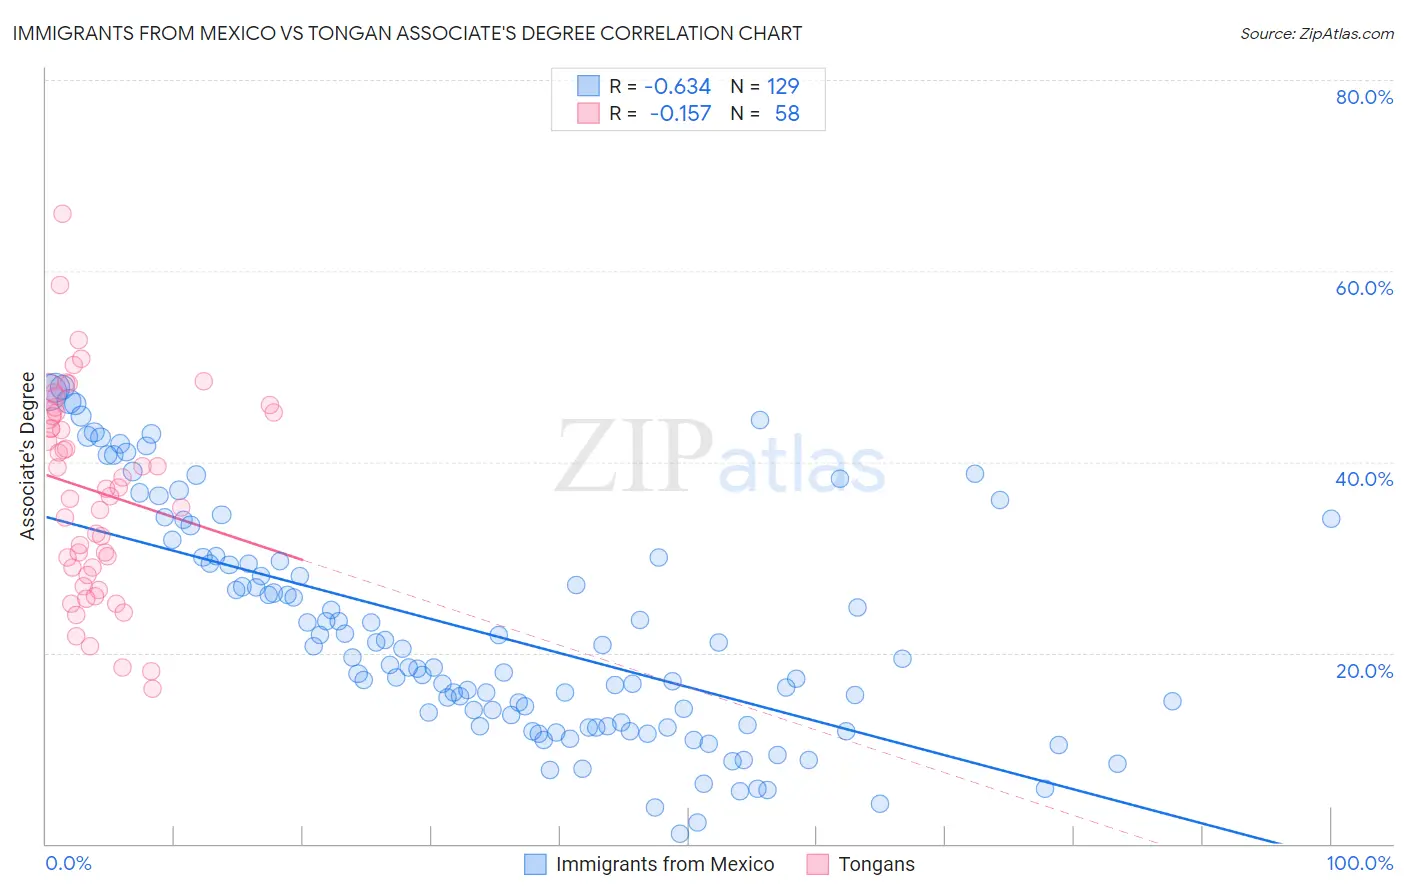
Immigrants from Mexico vs Tongan Associate's Degree Correlation Chart
The statistical analysis conducted on geographies consisting of 513,696,762 people shows a significant negative correlation between the proportion of Immigrants from Mexico and percentage of population with at least associate's degree education in the United States with a correlation coefficient (R) of -0.634 and weighted average of 33.7%. Similarly, the statistical analysis conducted on geographies consisting of 102,908,759 people shows a poor negative correlation between the proportion of Tongans and percentage of population with at least associate's degree education in the United States with a correlation coefficient (R) of -0.157 and weighted average of 43.0%, a difference of 27.6%.
Associate's Degree Correlation Summary
| Measurement | Immigrants from Mexico | Tongan |
| Minimum | 0.99% | 16.2% |
| Maximum | 47.9% | 65.9% |
| Range | 46.9% | 49.7% |
| Mean | 22.3% | 37.0% |
| Median | 19.4% | 37.2% |
| Interquartile 25% (IQ1) | 12.4% | 28.9% |
| Interquartile 75% (IQ3) | 30.0% | 45.1% |
| Interquartile Range (IQR) | 17.6% | 16.2% |
| Standard Deviation (Sample) | 12.0% | 10.6% |
| Standard Deviation (Population) | 11.9% | 10.5% |
Similar Demographics by Associate's Degree
Demographics Similar to Immigrants from Mexico by Associate's Degree
In terms of associate's degree, the demographic groups most similar to Immigrants from Mexico are Pueblo (34.0%, a difference of 0.71%), Lumbee (34.1%, a difference of 1.1%), Hopi (34.6%, a difference of 2.4%), Spanish American Indian (34.9%, a difference of 3.3%), and Native/Alaskan (34.9%, a difference of 3.5%).
| Demographics | Rating | Rank | Associate's Degree |
| Immigrants | Central America | 0.0 /100 | #332 | Tragic 35.0% |
| Mexicans | 0.0 /100 | #333 | Tragic 35.0% |
| Natives/Alaskans | 0.0 /100 | #334 | Tragic 34.9% |
| Spanish American Indians | 0.0 /100 | #335 | Tragic 34.9% |
| Hopi | 0.0 /100 | #336 | Tragic 34.6% |
| Lumbee | 0.0 /100 | #337 | Tragic 34.1% |
| Pueblo | 0.0 /100 | #338 | Tragic 34.0% |
| Immigrants | Mexico | 0.0 /100 | #339 | Tragic 33.7% |
| Navajo | 0.0 /100 | #340 | Tragic 32.6% |
| Inupiat | 0.0 /100 | #341 | Tragic 32.6% |
| Yakama | 0.0 /100 | #342 | Tragic 32.3% |
| Tohono O'odham | 0.0 /100 | #343 | Tragic 31.8% |
| Yuman | 0.0 /100 | #344 | Tragic 31.3% |
| Pima | 0.0 /100 | #345 | Tragic 30.2% |
| Houma | 0.0 /100 | #346 | Tragic 28.2% |
Demographics Similar to Tongans by Associate's Degree
In terms of associate's degree, the demographic groups most similar to Tongans are Tlingit-Haida (43.0%, a difference of 0.090%), Native Hawaiian (43.1%, a difference of 0.16%), Ecuadorian (43.0%, a difference of 0.19%), Immigrants from St. Vincent and the Grenadines (42.9%, a difference of 0.27%), and Nonimmigrants (42.9%, a difference of 0.29%).
| Demographics | Rating | Rank | Associate's Degree |
| Immigrants | Burma/Myanmar | 4.3 /100 | #226 | Tragic 43.7% |
| Trinidadians and Tobagonians | 4.0 /100 | #227 | Tragic 43.6% |
| Hmong | 3.2 /100 | #228 | Tragic 43.4% |
| Immigrants | Trinidad and Tobago | 3.0 /100 | #229 | Tragic 43.3% |
| Immigrants | Barbados | 2.9 /100 | #230 | Tragic 43.3% |
| Liberians | 2.9 /100 | #231 | Tragic 43.3% |
| Native Hawaiians | 2.3 /100 | #232 | Tragic 43.1% |
| Tongans | 2.2 /100 | #233 | Tragic 43.0% |
| Tlingit-Haida | 2.1 /100 | #234 | Tragic 43.0% |
| Ecuadorians | 2.0 /100 | #235 | Tragic 43.0% |
| Immigrants | St. Vincent and the Grenadines | 1.9 /100 | #236 | Tragic 42.9% |
| Immigrants | Nonimmigrants | 1.9 /100 | #237 | Tragic 42.9% |
| Iroquois | 1.7 /100 | #238 | Tragic 42.8% |
| Immigrants | Grenada | 1.3 /100 | #239 | Tragic 42.6% |
| Cree | 1.2 /100 | #240 | Tragic 42.5% |