Immigrants from Mexico vs Immigrants from Italy Associate's Degree
COMPARE
Immigrants from Mexico
Immigrants from Italy
Associate's Degree
Associate's Degree Comparison
Immigrants from Mexico
Immigrants from Italy
33.7%
ASSOCIATE'S DEGREE
0.0/ 100
METRIC RATING
339th/ 347
METRIC RANK
49.3%
ASSOCIATE'S DEGREE
96.7/ 100
METRIC RATING
106th/ 347
METRIC RANK
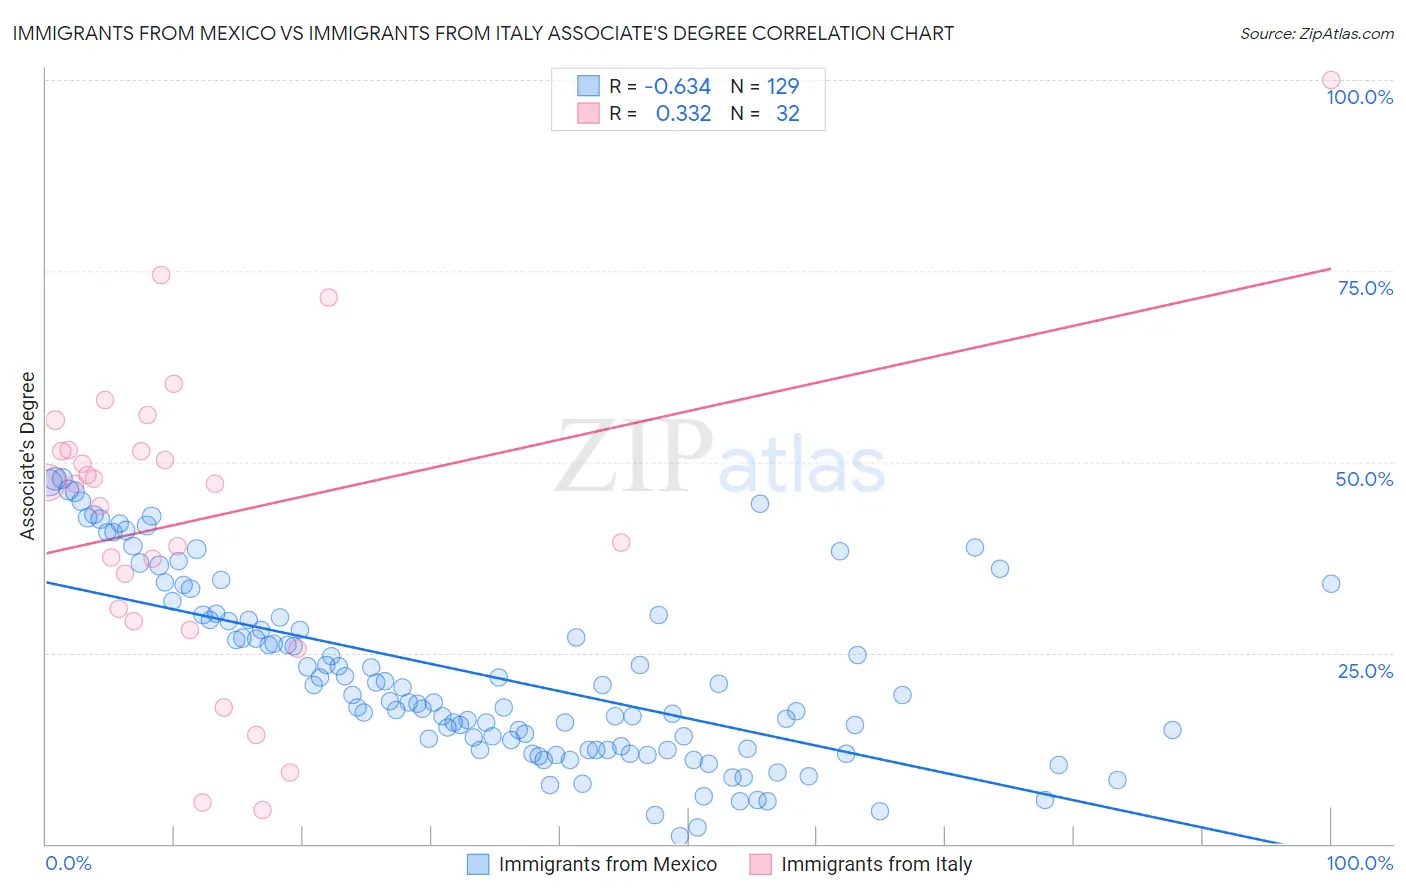
Immigrants from Mexico vs Immigrants from Italy Associate's Degree Correlation Chart
The statistical analysis conducted on geographies consisting of 513,696,762 people shows a significant negative correlation between the proportion of Immigrants from Mexico and percentage of population with at least associate's degree education in the United States with a correlation coefficient (R) of -0.634 and weighted average of 33.7%. Similarly, the statistical analysis conducted on geographies consisting of 324,223,165 people shows a mild positive correlation between the proportion of Immigrants from Italy and percentage of population with at least associate's degree education in the United States with a correlation coefficient (R) of 0.332 and weighted average of 49.3%, a difference of 46.1%.
Associate's Degree Correlation Summary
| Measurement | Immigrants from Mexico | Immigrants from Italy |
| Minimum | 0.99% | 4.5% |
| Maximum | 47.9% | 100.0% |
| Range | 46.9% | 95.5% |
| Mean | 22.3% | 42.7% |
| Median | 19.4% | 47.1% |
| Interquartile 25% (IQ1) | 12.4% | 30.0% |
| Interquartile 75% (IQ3) | 30.0% | 51.5% |
| Interquartile Range (IQR) | 17.6% | 21.5% |
| Standard Deviation (Sample) | 12.0% | 20.4% |
| Standard Deviation (Population) | 11.9% | 20.0% |
Similar Demographics by Associate's Degree
Demographics Similar to Immigrants from Mexico by Associate's Degree
In terms of associate's degree, the demographic groups most similar to Immigrants from Mexico are Pueblo (34.0%, a difference of 0.71%), Lumbee (34.1%, a difference of 1.1%), Hopi (34.6%, a difference of 2.4%), Spanish American Indian (34.9%, a difference of 3.3%), and Native/Alaskan (34.9%, a difference of 3.5%).
| Demographics | Rating | Rank | Associate's Degree |
| Immigrants | Central America | 0.0 /100 | #332 | Tragic 35.0% |
| Mexicans | 0.0 /100 | #333 | Tragic 35.0% |
| Natives/Alaskans | 0.0 /100 | #334 | Tragic 34.9% |
| Spanish American Indians | 0.0 /100 | #335 | Tragic 34.9% |
| Hopi | 0.0 /100 | #336 | Tragic 34.6% |
| Lumbee | 0.0 /100 | #337 | Tragic 34.1% |
| Pueblo | 0.0 /100 | #338 | Tragic 34.0% |
| Immigrants | Mexico | 0.0 /100 | #339 | Tragic 33.7% |
| Navajo | 0.0 /100 | #340 | Tragic 32.6% |
| Inupiat | 0.0 /100 | #341 | Tragic 32.6% |
| Yakama | 0.0 /100 | #342 | Tragic 32.3% |
| Tohono O'odham | 0.0 /100 | #343 | Tragic 31.8% |
| Yuman | 0.0 /100 | #344 | Tragic 31.3% |
| Pima | 0.0 /100 | #345 | Tragic 30.2% |
| Houma | 0.0 /100 | #346 | Tragic 28.2% |
Demographics Similar to Immigrants from Italy by Associate's Degree
In terms of associate's degree, the demographic groups most similar to Immigrants from Italy are Croatian (49.3%, a difference of 0.0%), Syrian (49.3%, a difference of 0.030%), Jordanian (49.2%, a difference of 0.090%), Venezuelan (49.4%, a difference of 0.15%), and Ukrainian (49.4%, a difference of 0.21%).
| Demographics | Rating | Rank | Associate's Degree |
| Macedonians | 97.8 /100 | #99 | Exceptional 49.6% |
| Immigrants | Nepal | 97.5 /100 | #100 | Exceptional 49.5% |
| Northern Europeans | 97.3 /100 | #101 | Exceptional 49.5% |
| Chileans | 97.3 /100 | #102 | Exceptional 49.4% |
| Ukrainians | 97.1 /100 | #103 | Exceptional 49.4% |
| Venezuelans | 97.0 /100 | #104 | Exceptional 49.4% |
| Croatians | 96.8 /100 | #105 | Exceptional 49.3% |
| Immigrants | Italy | 96.7 /100 | #106 | Exceptional 49.3% |
| Syrians | 96.7 /100 | #107 | Exceptional 49.3% |
| Jordanians | 96.6 /100 | #108 | Exceptional 49.2% |
| Immigrants | Morocco | 96.3 /100 | #109 | Exceptional 49.2% |
| Austrians | 95.8 /100 | #110 | Exceptional 49.1% |
| Immigrants | Venezuela | 95.8 /100 | #111 | Exceptional 49.1% |
| Immigrants | Chile | 95.3 /100 | #112 | Exceptional 49.0% |
| Palestinians | 95.3 /100 | #113 | Exceptional 49.0% |