Immigrants from Mexico vs Marshallese 2nd Grade
COMPARE
Immigrants from Mexico
Marshallese
2nd Grade
2nd Grade Comparison
Immigrants from Mexico
Marshallese
96.1%
2ND GRADE
0.0/ 100
METRIC RATING
342nd/ 347
METRIC RANK
97.9%
2ND GRADE
67.7/ 100
METRIC RATING
154th/ 347
METRIC RANK
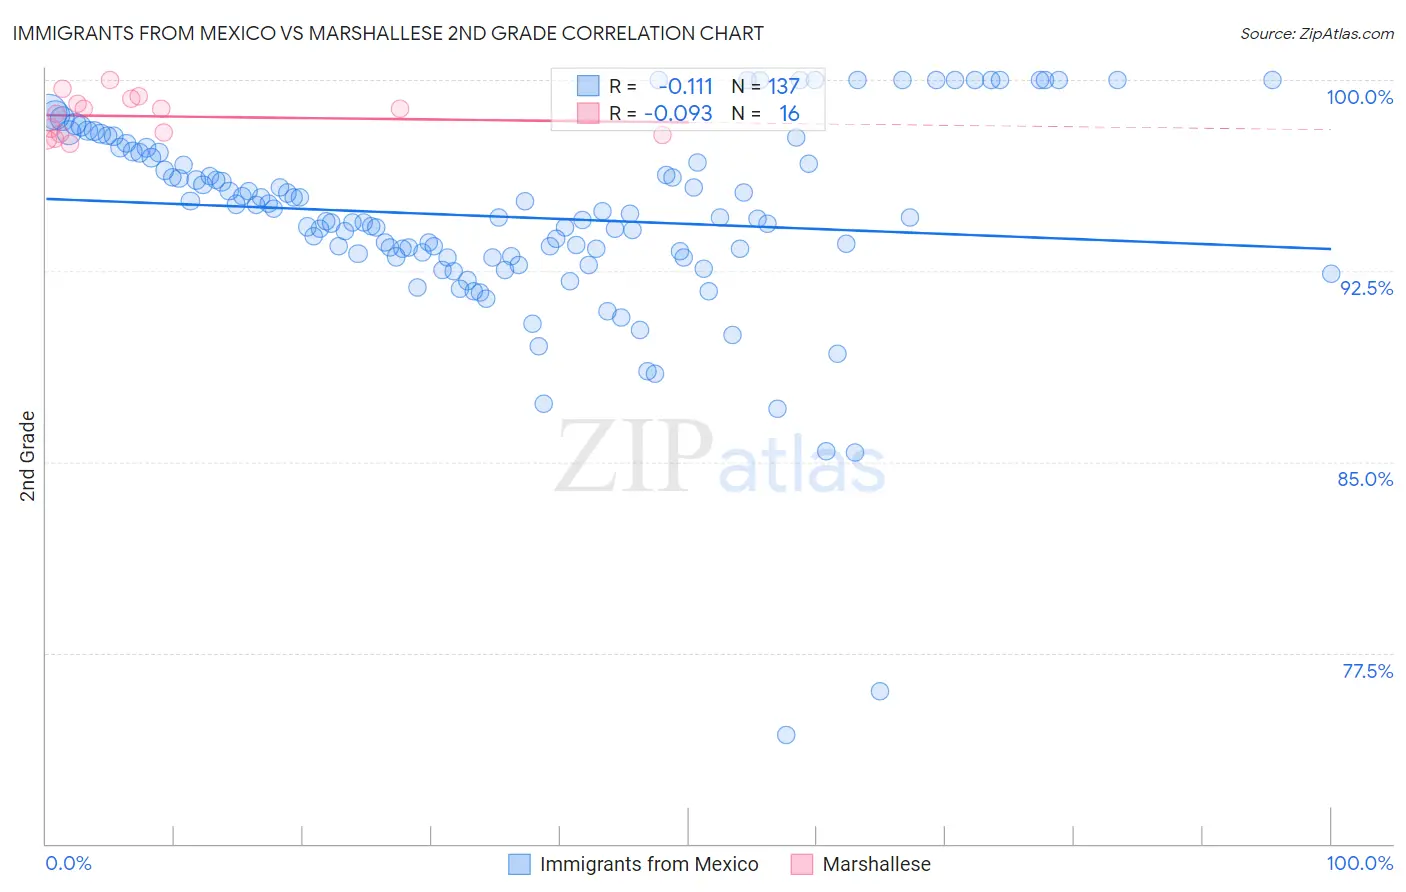
Immigrants from Mexico vs Marshallese 2nd Grade Correlation Chart
The statistical analysis conducted on geographies consisting of 513,767,418 people shows a poor negative correlation between the proportion of Immigrants from Mexico and percentage of population with at least 2nd grade education in the United States with a correlation coefficient (R) of -0.111 and weighted average of 96.1%. Similarly, the statistical analysis conducted on geographies consisting of 14,761,315 people shows a slight negative correlation between the proportion of Marshallese and percentage of population with at least 2nd grade education in the United States with a correlation coefficient (R) of -0.093 and weighted average of 97.9%, a difference of 1.9%.
2nd Grade Correlation Summary
| Measurement | Immigrants from Mexico | Marshallese |
| Minimum | 74.3% | 97.5% |
| Maximum | 100.0% | 100.0% |
| Range | 25.7% | 2.5% |
| Mean | 94.6% | 98.6% |
| Median | 94.6% | 98.8% |
| Interquartile 25% (IQ1) | 93.1% | 97.9% |
| Interquartile 75% (IQ3) | 97.2% | 99.1% |
| Interquartile Range (IQR) | 4.1% | 1.3% |
| Standard Deviation (Sample) | 4.0% | 0.78% |
| Standard Deviation (Population) | 3.9% | 0.75% |
Similar Demographics by 2nd Grade
Demographics Similar to Immigrants from Mexico by 2nd Grade
In terms of 2nd grade, the demographic groups most similar to Immigrants from Mexico are Immigrants from Central America (96.2%, a difference of 0.030%), Immigrants from Guatemala (96.2%, a difference of 0.040%), Nepalese (96.1%, a difference of 0.090%), Salvadoran (96.0%, a difference of 0.12%), and Guatemalan (96.3%, a difference of 0.18%).
| Demographics | Rating | Rank | 2nd Grade |
| Immigrants | Dominican Republic | 0.0 /100 | #333 | Tragic 96.4% |
| Central Americans | 0.0 /100 | #334 | Tragic 96.4% |
| Yakama | 0.0 /100 | #335 | Tragic 96.4% |
| Immigrants | Fiji | 0.0 /100 | #336 | Tragic 96.4% |
| Immigrants | Cambodia | 0.0 /100 | #337 | Tragic 96.4% |
| Immigrants | Cabo Verde | 0.0 /100 | #338 | Tragic 96.3% |
| Guatemalans | 0.0 /100 | #339 | Tragic 96.3% |
| Immigrants | Guatemala | 0.0 /100 | #340 | Tragic 96.2% |
| Immigrants | Central America | 0.0 /100 | #341 | Tragic 96.2% |
| Immigrants | Mexico | 0.0 /100 | #342 | Tragic 96.1% |
| Nepalese | 0.0 /100 | #343 | Tragic 96.1% |
| Salvadorans | 0.0 /100 | #344 | Tragic 96.0% |
| Immigrants | El Salvador | 0.0 /100 | #345 | Tragic 95.9% |
| Immigrants | Yemen | 0.0 /100 | #346 | Tragic 95.7% |
| Spanish American Indians | 0.0 /100 | #347 | Tragic 95.6% |
Demographics Similar to Marshallese by 2nd Grade
In terms of 2nd grade, the demographic groups most similar to Marshallese are Immigrants from North Macedonia (97.9%, a difference of 0.0%), Immigrants from South Central Asia (97.9%, a difference of 0.0%), Soviet Union (97.9%, a difference of 0.010%), French American Indian (97.9%, a difference of 0.010%), and Dutch West Indian (97.9%, a difference of 0.010%).
| Demographics | Rating | Rank | 2nd Grade |
| Immigrants | Greece | 76.8 /100 | #147 | Good 98.0% |
| Jordanians | 74.5 /100 | #148 | Good 98.0% |
| Apache | 74.0 /100 | #149 | Good 97.9% |
| Immigrants | Moldova | 72.9 /100 | #150 | Good 97.9% |
| Soviet Union | 70.7 /100 | #151 | Good 97.9% |
| Immigrants | North Macedonia | 68.5 /100 | #152 | Good 97.9% |
| Immigrants | South Central Asia | 68.3 /100 | #153 | Good 97.9% |
| Marshallese | 67.7 /100 | #154 | Good 97.9% |
| French American Indians | 64.3 /100 | #155 | Good 97.9% |
| Dutch West Indians | 63.8 /100 | #156 | Good 97.9% |
| Venezuelans | 63.3 /100 | #157 | Good 97.9% |
| Immigrants | Iran | 62.8 /100 | #158 | Good 97.9% |
| Comanche | 62.8 /100 | #159 | Good 97.9% |
| Immigrants | Eastern Europe | 61.1 /100 | #160 | Good 97.9% |
| Immigrants | Russia | 60.3 /100 | #161 | Good 97.9% |