Immigrants from Mexico vs Immigrants from Portugal 2nd Grade
COMPARE
Immigrants from Mexico
Immigrants from Portugal
2nd Grade
2nd Grade Comparison
Immigrants from Mexico
Immigrants from Portugal
96.1%
2ND GRADE
0.0/ 100
METRIC RATING
342nd/ 347
METRIC RANK
97.2%
2ND GRADE
0.0/ 100
METRIC RATING
287th/ 347
METRIC RANK
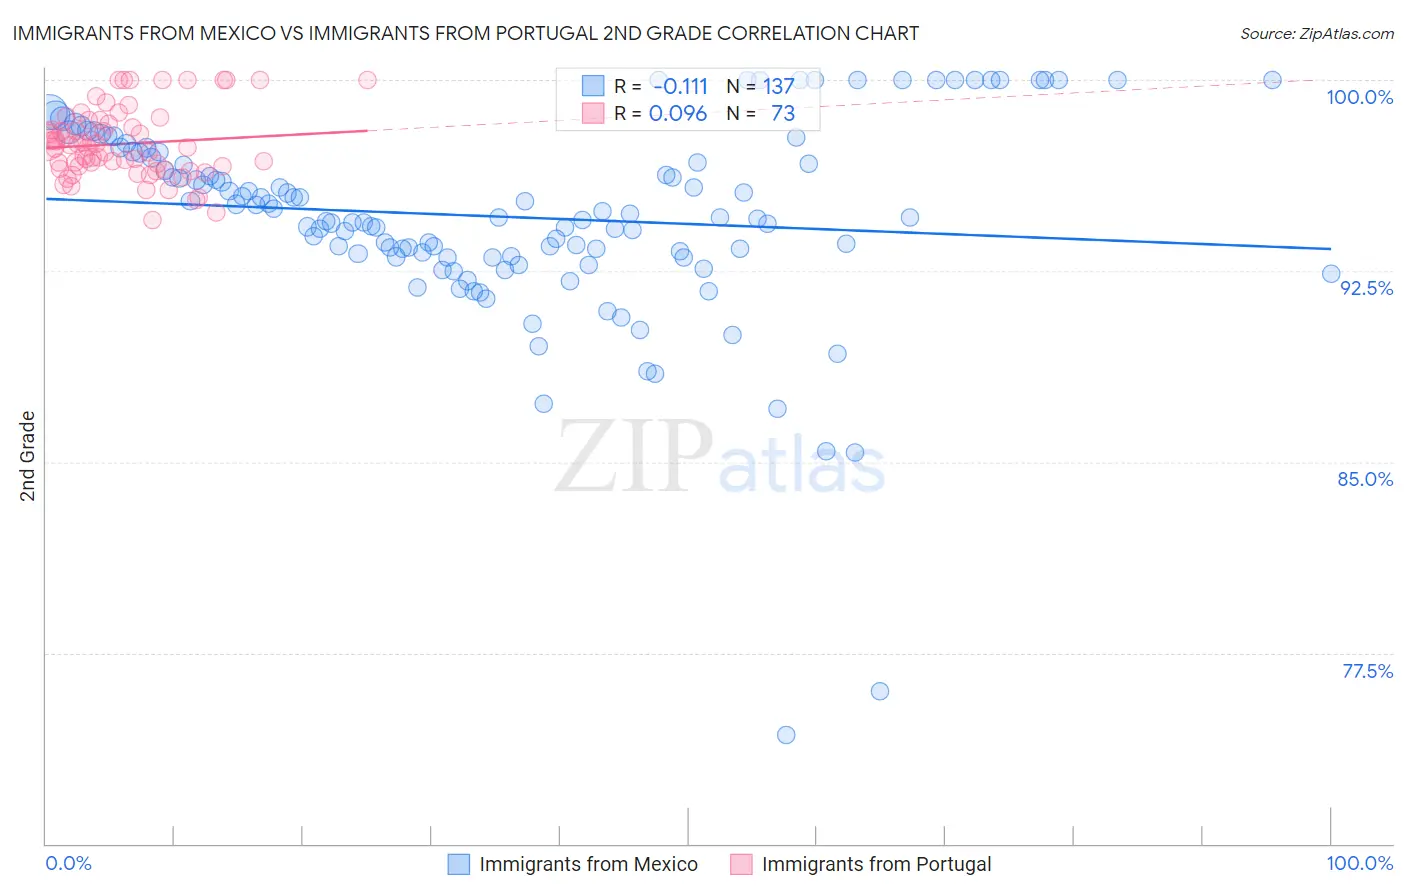
Immigrants from Mexico vs Immigrants from Portugal 2nd Grade Correlation Chart
The statistical analysis conducted on geographies consisting of 513,767,418 people shows a poor negative correlation between the proportion of Immigrants from Mexico and percentage of population with at least 2nd grade education in the United States with a correlation coefficient (R) of -0.111 and weighted average of 96.1%. Similarly, the statistical analysis conducted on geographies consisting of 174,792,107 people shows a slight positive correlation between the proportion of Immigrants from Portugal and percentage of population with at least 2nd grade education in the United States with a correlation coefficient (R) of 0.096 and weighted average of 97.2%, a difference of 1.1%.
2nd Grade Correlation Summary
| Measurement | Immigrants from Mexico | Immigrants from Portugal |
| Minimum | 74.3% | 94.5% |
| Maximum | 100.0% | 100.0% |
| Range | 25.7% | 5.5% |
| Mean | 94.6% | 97.5% |
| Median | 94.6% | 97.4% |
| Interquartile 25% (IQ1) | 93.1% | 96.6% |
| Interquartile 75% (IQ3) | 97.2% | 98.3% |
| Interquartile Range (IQR) | 4.1% | 1.8% |
| Standard Deviation (Sample) | 4.0% | 1.4% |
| Standard Deviation (Population) | 3.9% | 1.3% |
Similar Demographics by 2nd Grade
Demographics Similar to Immigrants from Mexico by 2nd Grade
In terms of 2nd grade, the demographic groups most similar to Immigrants from Mexico are Immigrants from Central America (96.2%, a difference of 0.030%), Immigrants from Guatemala (96.2%, a difference of 0.040%), Nepalese (96.1%, a difference of 0.090%), Salvadoran (96.0%, a difference of 0.12%), and Guatemalan (96.3%, a difference of 0.18%).
| Demographics | Rating | Rank | 2nd Grade |
| Immigrants | Dominican Republic | 0.0 /100 | #333 | Tragic 96.4% |
| Central Americans | 0.0 /100 | #334 | Tragic 96.4% |
| Yakama | 0.0 /100 | #335 | Tragic 96.4% |
| Immigrants | Fiji | 0.0 /100 | #336 | Tragic 96.4% |
| Immigrants | Cambodia | 0.0 /100 | #337 | Tragic 96.4% |
| Immigrants | Cabo Verde | 0.0 /100 | #338 | Tragic 96.3% |
| Guatemalans | 0.0 /100 | #339 | Tragic 96.3% |
| Immigrants | Guatemala | 0.0 /100 | #340 | Tragic 96.2% |
| Immigrants | Central America | 0.0 /100 | #341 | Tragic 96.2% |
| Immigrants | Mexico | 0.0 /100 | #342 | Tragic 96.1% |
| Nepalese | 0.0 /100 | #343 | Tragic 96.1% |
| Salvadorans | 0.0 /100 | #344 | Tragic 96.0% |
| Immigrants | El Salvador | 0.0 /100 | #345 | Tragic 95.9% |
| Immigrants | Yemen | 0.0 /100 | #346 | Tragic 95.7% |
| Spanish American Indians | 0.0 /100 | #347 | Tragic 95.6% |
Demographics Similar to Immigrants from Portugal by 2nd Grade
In terms of 2nd grade, the demographic groups most similar to Immigrants from Portugal are Immigrants from Hong Kong (97.2%, a difference of 0.0%), Immigrants from Barbados (97.2%, a difference of 0.0%), Immigrants from Thailand (97.2%, a difference of 0.010%), Immigrants from Trinidad and Tobago (97.2%, a difference of 0.020%), and Immigrants from West Indies (97.2%, a difference of 0.020%).
| Demographics | Rating | Rank | 2nd Grade |
| Afghans | 0.1 /100 | #280 | Tragic 97.3% |
| Trinidadians and Tobagonians | 0.1 /100 | #281 | Tragic 97.3% |
| Barbadians | 0.1 /100 | #282 | Tragic 97.3% |
| Immigrants | Trinidad and Tobago | 0.0 /100 | #283 | Tragic 97.2% |
| Immigrants | West Indies | 0.0 /100 | #284 | Tragic 97.2% |
| Immigrants | Hong Kong | 0.0 /100 | #285 | Tragic 97.2% |
| Immigrants | Barbados | 0.0 /100 | #286 | Tragic 97.2% |
| Immigrants | Portugal | 0.0 /100 | #287 | Tragic 97.2% |
| Immigrants | Thailand | 0.0 /100 | #288 | Tragic 97.2% |
| Houma | 0.0 /100 | #289 | Tragic 97.2% |
| Immigrants | St. Vincent and the Grenadines | 0.0 /100 | #290 | Tragic 97.2% |
| Immigrants | Afghanistan | 0.0 /100 | #291 | Tragic 97.2% |
| Immigrants | Eritrea | 0.0 /100 | #292 | Tragic 97.2% |
| British West Indians | 0.0 /100 | #293 | Tragic 97.2% |
| Malaysians | 0.0 /100 | #294 | Tragic 97.1% |