Immigrants from Mexico vs Guamanian/Chamorro 2nd Grade
COMPARE
Immigrants from Mexico
Guamanian/Chamorro
2nd Grade
2nd Grade Comparison
Immigrants from Mexico
Guamanians/Chamorros
96.1%
2ND GRADE
0.0/ 100
METRIC RATING
342nd/ 347
METRIC RANK
97.8%
2ND GRADE
25.7/ 100
METRIC RATING
198th/ 347
METRIC RANK
Immigrants from Mexico vs Guamanian/Chamorro 2nd Grade Correlation Chart
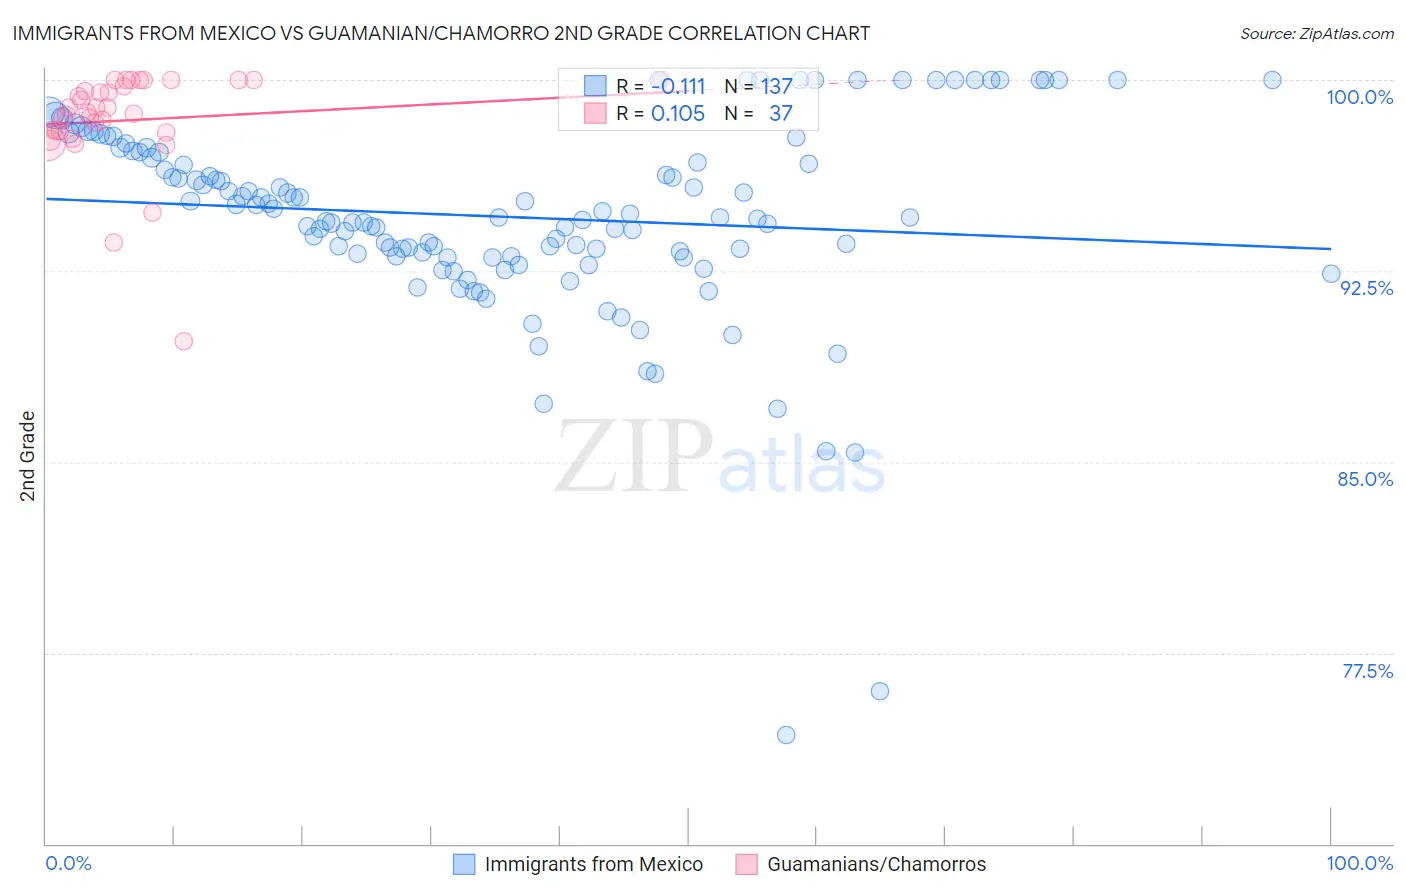
The statistical analysis conducted on geographies consisting of 513,767,418 people shows a poor negative correlation between the proportion of Immigrants from Mexico and percentage of population with at least 2nd grade education in the United States with a correlation coefficient (R) of -0.111 and weighted average of 96.1%. Similarly, the statistical analysis conducted on geographies consisting of 221,965,618 people shows a poor positive correlation between the proportion of Guamanians/Chamorros and percentage of population with at least 2nd grade education in the United States with a correlation coefficient (R) of 0.105 and weighted average of 97.8%, a difference of 1.7%.
2nd Grade Correlation Summary
| Measurement | Immigrants from Mexico | Guamanian/Chamorro |
| Minimum | 74.3% | 89.7% |
| Maximum | 100.0% | 100.0% |
| Range | 25.7% | 10.3% |
| Mean | 94.6% | 98.4% |
| Median | 94.6% | 98.7% |
| Interquartile 25% (IQ1) | 93.1% | 97.9% |
| Interquartile 75% (IQ3) | 97.2% | 99.9% |
| Interquartile Range (IQR) | 4.1% | 1.9% |
| Standard Deviation (Sample) | 4.0% | 2.0% |
| Standard Deviation (Population) | 3.9% | 2.0% |
Similar Demographics by 2nd Grade
Demographics Similar to Immigrants from Mexico by 2nd Grade
In terms of 2nd grade, the demographic groups most similar to Immigrants from Mexico are Immigrants from Central America (96.2%, a difference of 0.030%), Immigrants from Guatemala (96.2%, a difference of 0.040%), Nepalese (96.1%, a difference of 0.090%), Salvadoran (96.0%, a difference of 0.12%), and Guatemalan (96.3%, a difference of 0.18%).
| Demographics | Rating | Rank | 2nd Grade |
| Immigrants | Dominican Republic | 0.0 /100 | #333 | Tragic 96.4% |
| Central Americans | 0.0 /100 | #334 | Tragic 96.4% |
| Yakama | 0.0 /100 | #335 | Tragic 96.4% |
| Immigrants | Fiji | 0.0 /100 | #336 | Tragic 96.4% |
| Immigrants | Cambodia | 0.0 /100 | #337 | Tragic 96.4% |
| Immigrants | Cabo Verde | 0.0 /100 | #338 | Tragic 96.3% |
| Guatemalans | 0.0 /100 | #339 | Tragic 96.3% |
| Immigrants | Guatemala | 0.0 /100 | #340 | Tragic 96.2% |
| Immigrants | Central America | 0.0 /100 | #341 | Tragic 96.2% |
| Immigrants | Mexico | 0.0 /100 | #342 | Tragic 96.1% |
| Nepalese | 0.0 /100 | #343 | Tragic 96.1% |
| Salvadorans | 0.0 /100 | #344 | Tragic 96.0% |
| Immigrants | El Salvador | 0.0 /100 | #345 | Tragic 95.9% |
| Immigrants | Yemen | 0.0 /100 | #346 | Tragic 95.7% |
| Spanish American Indians | 0.0 /100 | #347 | Tragic 95.6% |
Demographics Similar to Guamanians/Chamorros by 2nd Grade
In terms of 2nd grade, the demographic groups most similar to Guamanians/Chamorros are Mongolian (97.8%, a difference of 0.0%), Immigrants from Kenya (97.8%, a difference of 0.0%), Immigrants from Uganda (97.8%, a difference of 0.0%), Hawaiian (97.8%, a difference of 0.010%), and Paiute (97.8%, a difference of 0.010%).
| Demographics | Rating | Rank | 2nd Grade |
| Paraguayans | 30.8 /100 | #191 | Fair 97.8% |
| Blacks/African Americans | 29.9 /100 | #192 | Fair 97.8% |
| Hawaiians | 28.5 /100 | #193 | Fair 97.8% |
| Paiute | 27.0 /100 | #194 | Fair 97.8% |
| Mongolians | 26.7 /100 | #195 | Fair 97.8% |
| Immigrants | Kenya | 26.4 /100 | #196 | Fair 97.8% |
| Immigrants | Uganda | 26.3 /100 | #197 | Fair 97.8% |
| Guamanians/Chamorros | 25.7 /100 | #198 | Fair 97.8% |
| Immigrants | Egypt | 24.4 /100 | #199 | Fair 97.8% |
| Immigrants | Lebanon | 20.9 /100 | #200 | Fair 97.8% |
| Tohono O'odham | 20.9 /100 | #201 | Fair 97.8% |
| Immigrants | Ukraine | 20.5 /100 | #202 | Fair 97.8% |
| Yuman | 20.0 /100 | #203 | Fair 97.8% |
| Immigrants | Albania | 18.4 /100 | #204 | Poor 97.8% |
| Immigrants | Southern Europe | 18.1 /100 | #205 | Poor 97.8% |