Immigrants from Malaysia vs Italian Professional Degree
COMPARE
Immigrants from Malaysia
Italian
Professional Degree
Professional Degree Comparison
Immigrants from Malaysia
Italians
5.7%
PROFESSIONAL DEGREE
100.0/ 100
METRIC RATING
56th/ 347
METRIC RANK
4.8%
PROFESSIONAL DEGREE
90.2/ 100
METRIC RATING
133rd/ 347
METRIC RANK
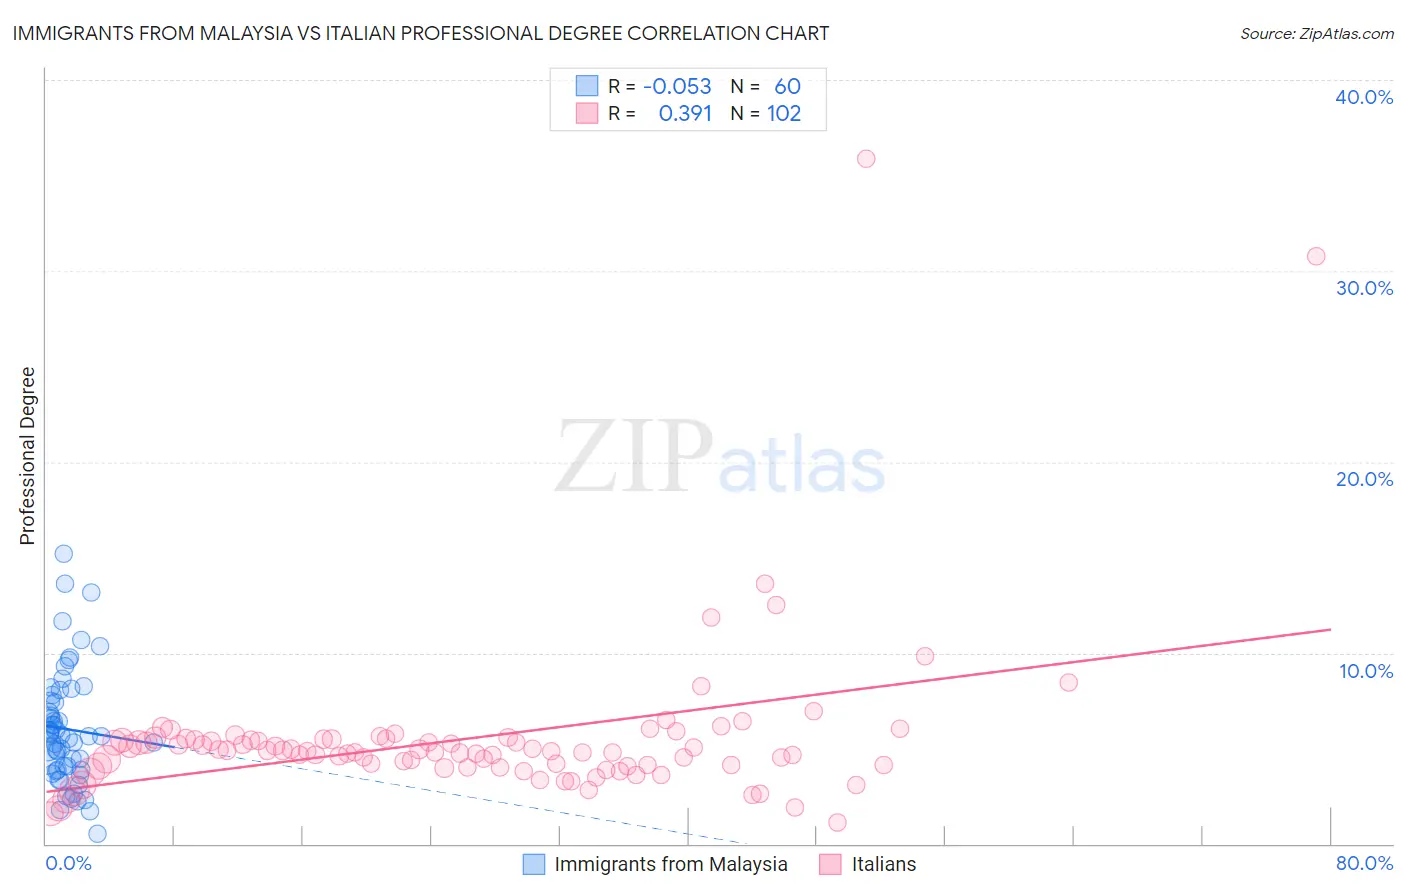
Immigrants from Malaysia vs Italian Professional Degree Correlation Chart
The statistical analysis conducted on geographies consisting of 197,901,227 people shows a slight negative correlation between the proportion of Immigrants from Malaysia and percentage of population with at least professional degree education in the United States with a correlation coefficient (R) of -0.053 and weighted average of 5.7%. Similarly, the statistical analysis conducted on geographies consisting of 566,305,731 people shows a mild positive correlation between the proportion of Italians and percentage of population with at least professional degree education in the United States with a correlation coefficient (R) of 0.391 and weighted average of 4.8%, a difference of 20.0%.
Professional Degree Correlation Summary
| Measurement | Immigrants from Malaysia | Italian |
| Minimum | 0.51% | 1.1% |
| Maximum | 15.2% | 35.9% |
| Range | 14.6% | 34.7% |
| Mean | 6.0% | 5.5% |
| Median | 5.6% | 4.9% |
| Interquartile 25% (IQ1) | 3.8% | 4.1% |
| Interquartile 75% (IQ3) | 7.6% | 5.5% |
| Interquartile Range (IQR) | 3.8% | 1.4% |
| Standard Deviation (Sample) | 3.0% | 4.4% |
| Standard Deviation (Population) | 3.0% | 4.4% |
Similar Demographics by Professional Degree
Demographics Similar to Immigrants from Malaysia by Professional Degree
In terms of professional degree, the demographic groups most similar to Immigrants from Malaysia are Immigrants from Western Europe (5.7%, a difference of 0.12%), South African (5.7%, a difference of 0.26%), Immigrants from Kuwait (5.7%, a difference of 0.52%), Bulgarian (5.7%, a difference of 0.86%), and Immigrants from Europe (5.6%, a difference of 1.4%).
| Demographics | Rating | Rank | Professional Degree |
| Immigrants | Latvia | 100.0 /100 | #49 | Exceptional 5.8% |
| Immigrants | Czechoslovakia | 100.0 /100 | #50 | Exceptional 5.8% |
| Immigrants | Greece | 100.0 /100 | #51 | Exceptional 5.8% |
| Immigrants | Serbia | 100.0 /100 | #52 | Exceptional 5.8% |
| Immigrants | Netherlands | 100.0 /100 | #53 | Exceptional 5.8% |
| Immigrants | Kuwait | 100.0 /100 | #54 | Exceptional 5.7% |
| Immigrants | Western Europe | 100.0 /100 | #55 | Exceptional 5.7% |
| Immigrants | Malaysia | 100.0 /100 | #56 | Exceptional 5.7% |
| South Africans | 100.0 /100 | #57 | Exceptional 5.7% |
| Bulgarians | 100.0 /100 | #58 | Exceptional 5.7% |
| Immigrants | Europe | 100.0 /100 | #59 | Exceptional 5.6% |
| Bolivians | 99.9 /100 | #60 | Exceptional 5.6% |
| Immigrants | Lithuania | 99.9 /100 | #61 | Exceptional 5.6% |
| Immigrants | Belarus | 99.9 /100 | #62 | Exceptional 5.5% |
| Asians | 99.9 /100 | #63 | Exceptional 5.5% |
Demographics Similar to Italians by Professional Degree
In terms of professional degree, the demographic groups most similar to Italians are South American Indian (4.8%, a difference of 0.12%), Macedonian (4.8%, a difference of 0.16%), Pakistani (4.8%, a difference of 0.25%), Immigrants from Jordan (4.7%, a difference of 0.44%), and Jordanian (4.7%, a difference of 0.46%).
| Demographics | Rating | Rank | Professional Degree |
| Europeans | 93.2 /100 | #126 | Exceptional 4.8% |
| Serbians | 92.6 /100 | #127 | Exceptional 4.8% |
| Immigrants | Eastern Africa | 92.5 /100 | #128 | Exceptional 4.8% |
| Palestinians | 91.5 /100 | #129 | Exceptional 4.8% |
| Icelanders | 91.5 /100 | #130 | Exceptional 4.8% |
| Immigrants | Nepal | 91.4 /100 | #131 | Exceptional 4.8% |
| Pakistanis | 90.9 /100 | #132 | Exceptional 4.8% |
| Italians | 90.2 /100 | #133 | Exceptional 4.8% |
| South American Indians | 89.9 /100 | #134 | Excellent 4.8% |
| Macedonians | 89.8 /100 | #135 | Excellent 4.8% |
| Immigrants | Jordan | 89.0 /100 | #136 | Excellent 4.7% |
| Jordanians | 88.9 /100 | #137 | Excellent 4.7% |
| Afghans | 88.8 /100 | #138 | Excellent 4.7% |
| South Americans | 85.6 /100 | #139 | Excellent 4.7% |
| Canadians | 84.4 /100 | #140 | Excellent 4.7% |