Immigrants from Lithuania vs Immigrants from South America College, Under 1 year
COMPARE
Immigrants from Lithuania
Immigrants from South America
College, Under 1 year
College, Under 1 year Comparison
Immigrants from Lithuania
Immigrants from South America
70.3%
COLLEGE, UNDER 1 YEAR
99.9/ 100
METRIC RATING
42nd/ 347
METRIC RANK
63.8%
COLLEGE, UNDER 1 YEAR
9.1/ 100
METRIC RATING
213th/ 347
METRIC RANK
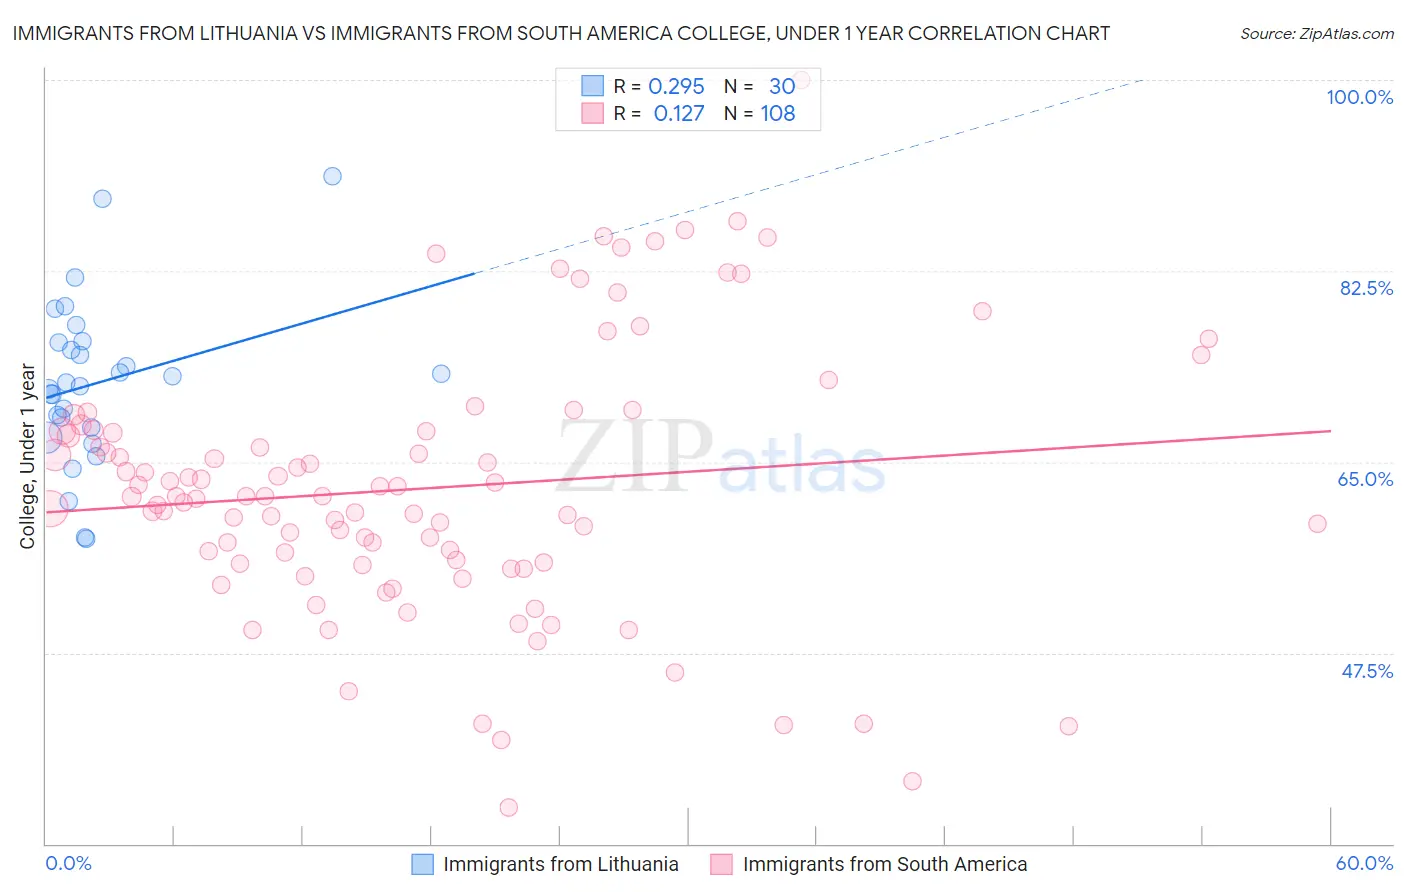
Immigrants from Lithuania vs Immigrants from South America College, Under 1 year Correlation Chart
The statistical analysis conducted on geographies consisting of 117,724,932 people shows a weak positive correlation between the proportion of Immigrants from Lithuania and percentage of population with at least college, under 1 year education in the United States with a correlation coefficient (R) of 0.295 and weighted average of 70.3%. Similarly, the statistical analysis conducted on geographies consisting of 486,373,097 people shows a poor positive correlation between the proportion of Immigrants from South America and percentage of population with at least college, under 1 year education in the United States with a correlation coefficient (R) of 0.127 and weighted average of 63.8%, a difference of 10.2%.
College, Under 1 year Correlation Summary
| Measurement | Immigrants from Lithuania | Immigrants from South America |
| Minimum | 57.9% | 33.3% |
| Maximum | 91.2% | 100.0% |
| Range | 33.3% | 66.7% |
| Mean | 72.3% | 62.6% |
| Median | 72.1% | 61.8% |
| Interquartile 25% (IQ1) | 68.2% | 55.7% |
| Interquartile 75% (IQ3) | 76.0% | 67.8% |
| Interquartile Range (IQR) | 7.8% | 12.1% |
| Standard Deviation (Sample) | 7.5% | 12.1% |
| Standard Deviation (Population) | 7.4% | 12.0% |
Similar Demographics by College, Under 1 year
Demographics Similar to Immigrants from Lithuania by College, Under 1 year
In terms of college, under 1 year, the demographic groups most similar to Immigrants from Lithuania are Immigrants from Kuwait (70.3%, a difference of 0.050%), Israeli (70.2%, a difference of 0.070%), New Zealander (70.2%, a difference of 0.070%), Immigrants from Turkey (70.3%, a difference of 0.090%), and Immigrants from Norway (70.2%, a difference of 0.090%).
| Demographics | Rating | Rank | College, Under 1 year |
| Russians | 99.9 /100 | #35 | Exceptional 70.5% |
| Immigrants | Sri Lanka | 99.9 /100 | #36 | Exceptional 70.5% |
| Immigrants | Saudi Arabia | 99.9 /100 | #37 | Exceptional 70.4% |
| Australians | 99.9 /100 | #38 | Exceptional 70.4% |
| Bhutanese | 99.9 /100 | #39 | Exceptional 70.3% |
| Immigrants | Turkey | 99.9 /100 | #40 | Exceptional 70.3% |
| Immigrants | Kuwait | 99.9 /100 | #41 | Exceptional 70.3% |
| Immigrants | Lithuania | 99.9 /100 | #42 | Exceptional 70.3% |
| Israelis | 99.9 /100 | #43 | Exceptional 70.2% |
| New Zealanders | 99.9 /100 | #44 | Exceptional 70.2% |
| Immigrants | Norway | 99.9 /100 | #45 | Exceptional 70.2% |
| Immigrants | Latvia | 99.9 /100 | #46 | Exceptional 70.1% |
| Immigrants | Bulgaria | 99.8 /100 | #47 | Exceptional 70.0% |
| Immigrants | Netherlands | 99.8 /100 | #48 | Exceptional 70.0% |
| Immigrants | Austria | 99.8 /100 | #49 | Exceptional 70.0% |
Demographics Similar to Immigrants from South America by College, Under 1 year
In terms of college, under 1 year, the demographic groups most similar to Immigrants from South America are Immigrants from Nigeria (63.7%, a difference of 0.040%), Immigrants from Middle Africa (63.9%, a difference of 0.18%), Native Hawaiian (63.9%, a difference of 0.19%), Senegalese (63.6%, a difference of 0.21%), and Ghanaian (63.9%, a difference of 0.26%).
| Demographics | Rating | Rank | College, Under 1 year |
| Whites/Caucasians | 12.8 /100 | #206 | Poor 64.0% |
| Colombians | 12.4 /100 | #207 | Poor 64.0% |
| Immigrants | Vietnam | 12.1 /100 | #208 | Poor 64.0% |
| Puget Sound Salish | 11.3 /100 | #209 | Poor 63.9% |
| Ghanaians | 11.2 /100 | #210 | Poor 63.9% |
| Native Hawaiians | 10.6 /100 | #211 | Poor 63.9% |
| Immigrants | Middle Africa | 10.5 /100 | #212 | Poor 63.9% |
| Immigrants | South America | 9.1 /100 | #213 | Tragic 63.8% |
| Immigrants | Nigeria | 8.8 /100 | #214 | Tragic 63.7% |
| Senegalese | 7.7 /100 | #215 | Tragic 63.6% |
| Hmong | 6.8 /100 | #216 | Tragic 63.5% |
| Immigrants | Uruguay | 5.8 /100 | #217 | Tragic 63.4% |
| Immigrants | Panama | 5.7 /100 | #218 | Tragic 63.4% |
| Immigrants | Fiji | 5.7 /100 | #219 | Tragic 63.4% |
| Portuguese | 5.6 /100 | #220 | Tragic 63.4% |