Immigrants from Liberia vs Chinese Nursery School
COMPARE
Immigrants from Liberia
Chinese
Nursery School
Nursery School Comparison
Immigrants from Liberia
Chinese
97.5%
NURSERY SCHOOL
0.3/ 100
METRIC RATING
269th/ 347
METRIC RANK
98.6%
NURSERY SCHOOL
100.0/ 100
METRIC RATING
34th/ 347
METRIC RANK
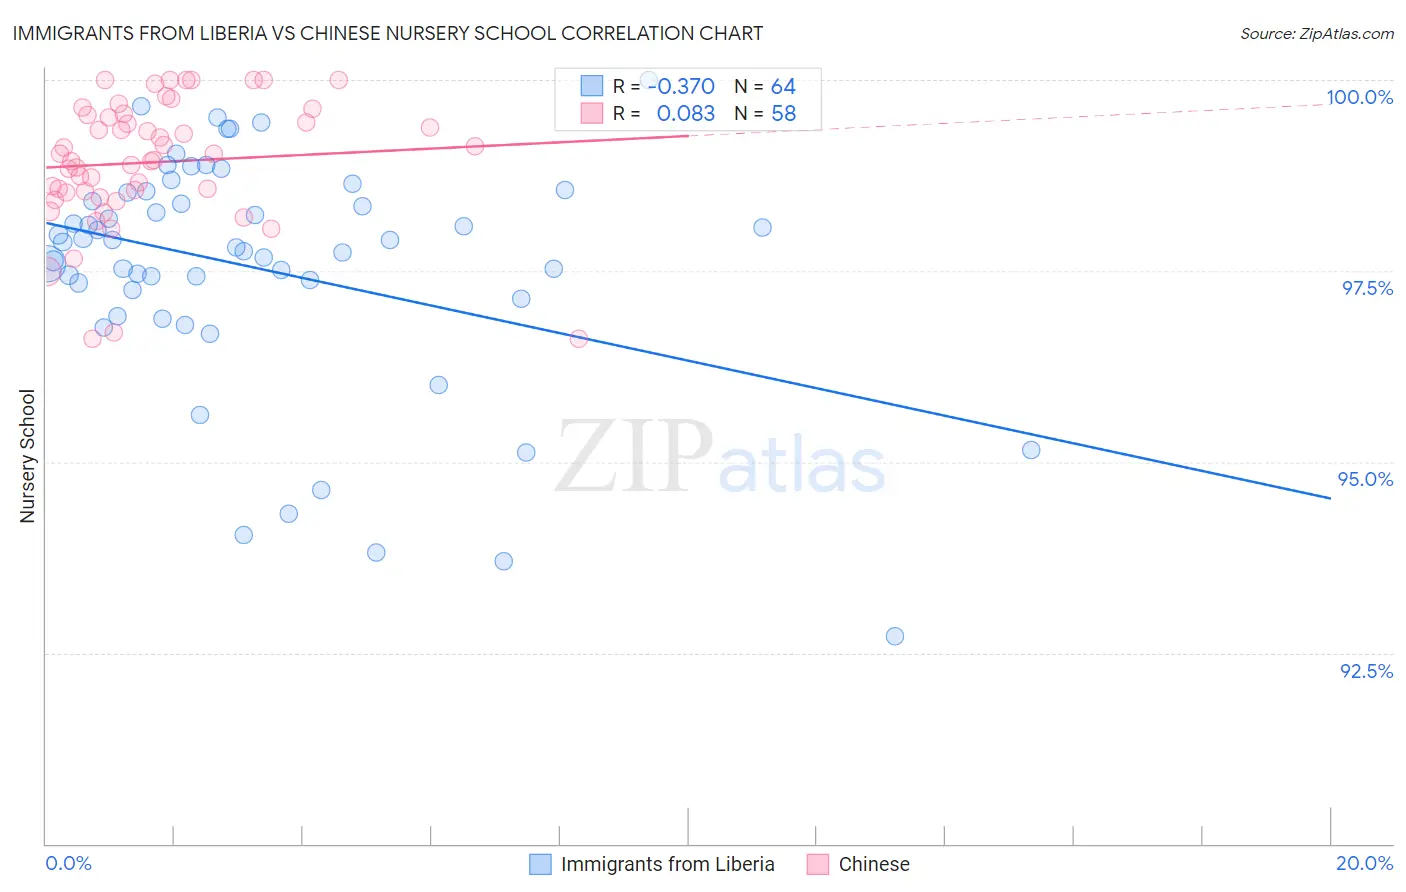
Immigrants from Liberia vs Chinese Nursery School Correlation Chart
The statistical analysis conducted on geographies consisting of 135,294,272 people shows a mild negative correlation between the proportion of Immigrants from Liberia and percentage of population with at least nursery school education in the United States with a correlation coefficient (R) of -0.370 and weighted average of 97.5%. Similarly, the statistical analysis conducted on geographies consisting of 64,808,307 people shows a slight positive correlation between the proportion of Chinese and percentage of population with at least nursery school education in the United States with a correlation coefficient (R) of 0.083 and weighted average of 98.6%, a difference of 1.1%.
Nursery School Correlation Summary
| Measurement | Immigrants from Liberia | Chinese |
| Minimum | 92.7% | 96.6% |
| Maximum | 100.0% | 100.0% |
| Range | 7.3% | 3.4% |
| Mean | 97.5% | 98.9% |
| Median | 97.8% | 99.0% |
| Interquartile 25% (IQ1) | 97.2% | 98.5% |
| Interquartile 75% (IQ3) | 98.5% | 99.5% |
| Interquartile Range (IQR) | 1.3% | 1.0% |
| Standard Deviation (Sample) | 1.5% | 0.83% |
| Standard Deviation (Population) | 1.5% | 0.82% |
Similar Demographics by Nursery School
Demographics Similar to Immigrants from Liberia by Nursery School
In terms of nursery school, the demographic groups most similar to Immigrants from Liberia are Immigrants from Nigeria (97.5%, a difference of 0.0%), West Indian (97.5%, a difference of 0.0%), Immigrants from Sierra Leone (97.6%, a difference of 0.010%), Immigrants from Jamaica (97.5%, a difference of 0.010%), and Fijian (97.6%, a difference of 0.020%).
| Demographics | Rating | Rank | Nursery School |
| Immigrants | Ethiopia | 0.4 /100 | #262 | Tragic 97.6% |
| Fijians | 0.3 /100 | #263 | Tragic 97.6% |
| Taiwanese | 0.3 /100 | #264 | Tragic 97.6% |
| Assyrians/Chaldeans/Syriacs | 0.3 /100 | #265 | Tragic 97.6% |
| Immigrants | Sierra Leone | 0.3 /100 | #266 | Tragic 97.6% |
| Immigrants | Nigeria | 0.3 /100 | #267 | Tragic 97.5% |
| West Indians | 0.3 /100 | #268 | Tragic 97.5% |
| Immigrants | Liberia | 0.3 /100 | #269 | Tragic 97.5% |
| Immigrants | Jamaica | 0.2 /100 | #270 | Tragic 97.5% |
| Immigrants | Peru | 0.2 /100 | #271 | Tragic 97.5% |
| Immigrants | Bolivia | 0.1 /100 | #272 | Tragic 97.5% |
| Immigrants | China | 0.1 /100 | #273 | Tragic 97.5% |
| Immigrants | Cameroon | 0.1 /100 | #274 | Tragic 97.5% |
| Ghanaians | 0.1 /100 | #275 | Tragic 97.5% |
| Immigrants | Philippines | 0.1 /100 | #276 | Tragic 97.5% |
Demographics Similar to Chinese by Nursery School
In terms of nursery school, the demographic groups most similar to Chinese are Swiss (98.6%, a difference of 0.0%), French Canadian (98.6%, a difference of 0.020%), Scandinavian (98.6%, a difference of 0.020%), British (98.5%, a difference of 0.020%), and French (98.6%, a difference of 0.030%).
| Demographics | Rating | Rank | Nursery School |
| Arapaho | 100.0 /100 | #27 | Exceptional 98.6% |
| Croatians | 100.0 /100 | #28 | Exceptional 98.6% |
| French | 100.0 /100 | #29 | Exceptional 98.6% |
| Europeans | 100.0 /100 | #30 | Exceptional 98.6% |
| Czechs | 100.0 /100 | #31 | Exceptional 98.6% |
| French Canadians | 100.0 /100 | #32 | Exceptional 98.6% |
| Scandinavians | 100.0 /100 | #33 | Exceptional 98.6% |
| Chinese | 100.0 /100 | #34 | Exceptional 98.6% |
| Swiss | 100.0 /100 | #35 | Exceptional 98.6% |
| British | 100.0 /100 | #36 | Exceptional 98.5% |
| Lumbee | 99.9 /100 | #37 | Exceptional 98.5% |
| Italians | 99.9 /100 | #38 | Exceptional 98.5% |
| Latvians | 99.9 /100 | #39 | Exceptional 98.5% |
| Chippewa | 99.9 /100 | #40 | Exceptional 98.5% |
| Luxembourgers | 99.9 /100 | #41 | Exceptional 98.5% |