Immigrants from Netherlands vs Chinese Nursery School
COMPARE
Immigrants from Netherlands
Chinese
Nursery School
Nursery School Comparison
Immigrants from Netherlands
Chinese
98.4%
NURSERY SCHOOL
99.4/ 100
METRIC RATING
74th/ 347
METRIC RANK
98.6%
NURSERY SCHOOL
100.0/ 100
METRIC RATING
34th/ 347
METRIC RANK
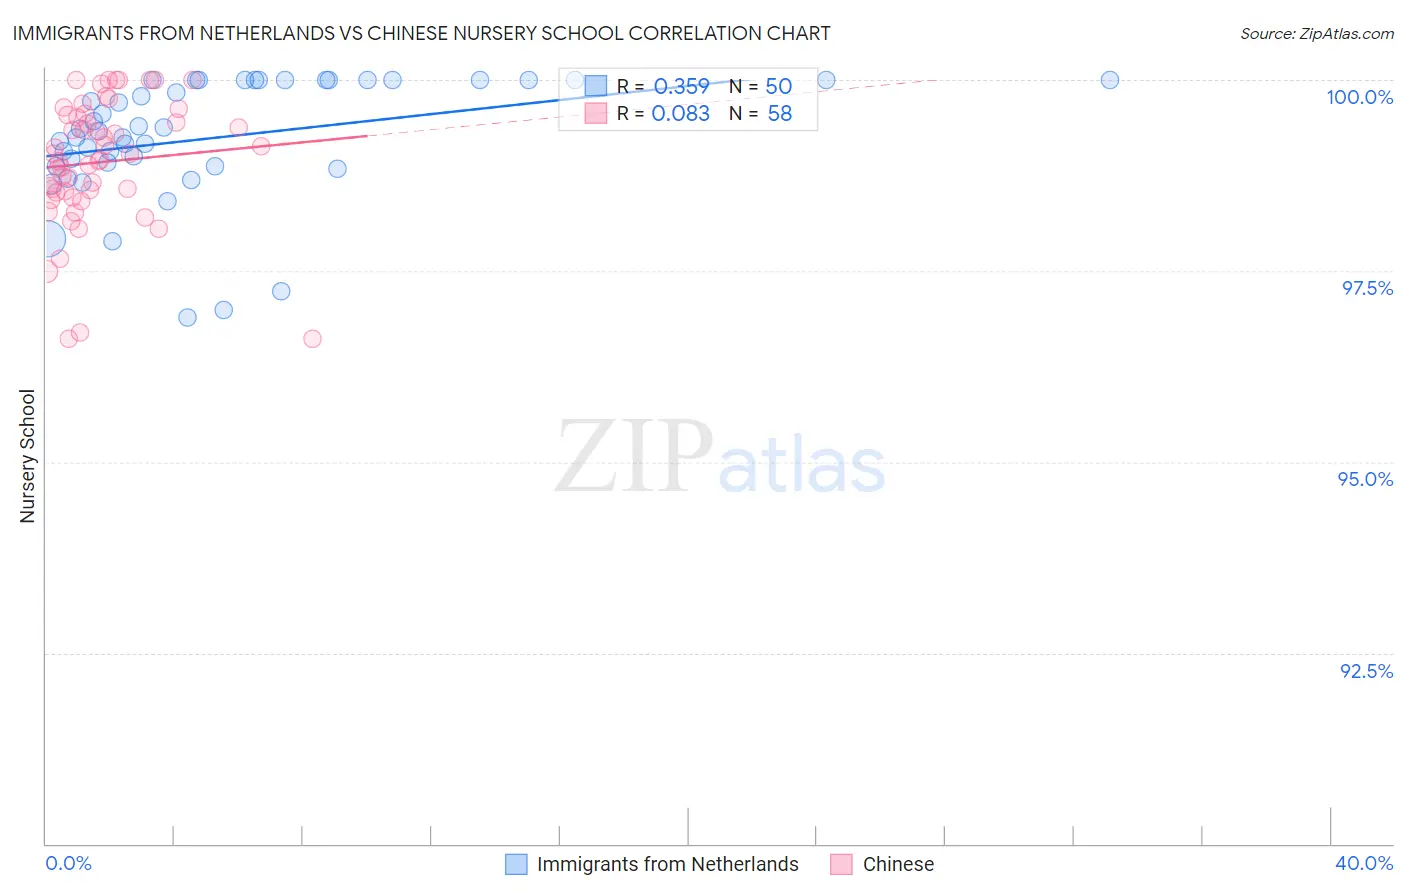
Immigrants from Netherlands vs Chinese Nursery School Correlation Chart
The statistical analysis conducted on geographies consisting of 237,869,934 people shows a mild positive correlation between the proportion of Immigrants from Netherlands and percentage of population with at least nursery school education in the United States with a correlation coefficient (R) of 0.359 and weighted average of 98.4%. Similarly, the statistical analysis conducted on geographies consisting of 64,808,307 people shows a slight positive correlation between the proportion of Chinese and percentage of population with at least nursery school education in the United States with a correlation coefficient (R) of 0.083 and weighted average of 98.6%, a difference of 0.21%.
Nursery School Correlation Summary
| Measurement | Immigrants from Netherlands | Chinese |
| Minimum | 96.9% | 96.6% |
| Maximum | 100.0% | 100.0% |
| Range | 3.1% | 3.4% |
| Mean | 99.2% | 98.9% |
| Median | 99.3% | 99.0% |
| Interquartile 25% (IQ1) | 98.9% | 98.5% |
| Interquartile 75% (IQ3) | 100.0% | 99.5% |
| Interquartile Range (IQR) | 1.1% | 1.0% |
| Standard Deviation (Sample) | 0.80% | 0.83% |
| Standard Deviation (Population) | 0.79% | 0.82% |
Similar Demographics by Nursery School
Demographics Similar to Immigrants from Netherlands by Nursery School
In terms of nursery school, the demographic groups most similar to Immigrants from Netherlands are Cajun (98.4%, a difference of 0.0%), Cherokee (98.3%, a difference of 0.010%), Immigrants from England (98.3%, a difference of 0.010%), Immigrants from Lithuania (98.3%, a difference of 0.010%), and Delaware (98.3%, a difference of 0.010%).
| Demographics | Rating | Rank | Nursery School |
| Immigrants | Northern Europe | 99.6 /100 | #67 | Exceptional 98.4% |
| Russians | 99.6 /100 | #68 | Exceptional 98.4% |
| Immigrants | Austria | 99.6 /100 | #69 | Exceptional 98.4% |
| Cheyenne | 99.6 /100 | #70 | Exceptional 98.4% |
| Serbians | 99.6 /100 | #71 | Exceptional 98.4% |
| Chickasaw | 99.6 /100 | #72 | Exceptional 98.4% |
| Cajuns | 99.4 /100 | #73 | Exceptional 98.4% |
| Immigrants | Netherlands | 99.4 /100 | #74 | Exceptional 98.4% |
| Cherokee | 99.3 /100 | #75 | Exceptional 98.3% |
| Immigrants | England | 99.3 /100 | #76 | Exceptional 98.3% |
| Immigrants | Lithuania | 99.3 /100 | #77 | Exceptional 98.3% |
| Delaware | 99.3 /100 | #78 | Exceptional 98.3% |
| Immigrants | Belgium | 99.3 /100 | #79 | Exceptional 98.3% |
| Shoshone | 99.3 /100 | #80 | Exceptional 98.3% |
| Icelanders | 99.2 /100 | #81 | Exceptional 98.3% |
Demographics Similar to Chinese by Nursery School
In terms of nursery school, the demographic groups most similar to Chinese are Swiss (98.6%, a difference of 0.0%), French Canadian (98.6%, a difference of 0.020%), Scandinavian (98.6%, a difference of 0.020%), British (98.5%, a difference of 0.020%), and French (98.6%, a difference of 0.030%).
| Demographics | Rating | Rank | Nursery School |
| Arapaho | 100.0 /100 | #27 | Exceptional 98.6% |
| Croatians | 100.0 /100 | #28 | Exceptional 98.6% |
| French | 100.0 /100 | #29 | Exceptional 98.6% |
| Europeans | 100.0 /100 | #30 | Exceptional 98.6% |
| Czechs | 100.0 /100 | #31 | Exceptional 98.6% |
| French Canadians | 100.0 /100 | #32 | Exceptional 98.6% |
| Scandinavians | 100.0 /100 | #33 | Exceptional 98.6% |
| Chinese | 100.0 /100 | #34 | Exceptional 98.6% |
| Swiss | 100.0 /100 | #35 | Exceptional 98.6% |
| British | 100.0 /100 | #36 | Exceptional 98.5% |
| Lumbee | 99.9 /100 | #37 | Exceptional 98.5% |
| Italians | 99.9 /100 | #38 | Exceptional 98.5% |
| Latvians | 99.9 /100 | #39 | Exceptional 98.5% |
| Chippewa | 99.9 /100 | #40 | Exceptional 98.5% |
| Luxembourgers | 99.9 /100 | #41 | Exceptional 98.5% |