Estonian vs Chinese Nursery School
COMPARE
Estonian
Chinese
Nursery School
Nursery School Comparison
Estonians
Chinese
98.5%
NURSERY SCHOOL
99.8/ 100
METRIC RATING
51st/ 347
METRIC RANK
98.6%
NURSERY SCHOOL
100.0/ 100
METRIC RATING
34th/ 347
METRIC RANK
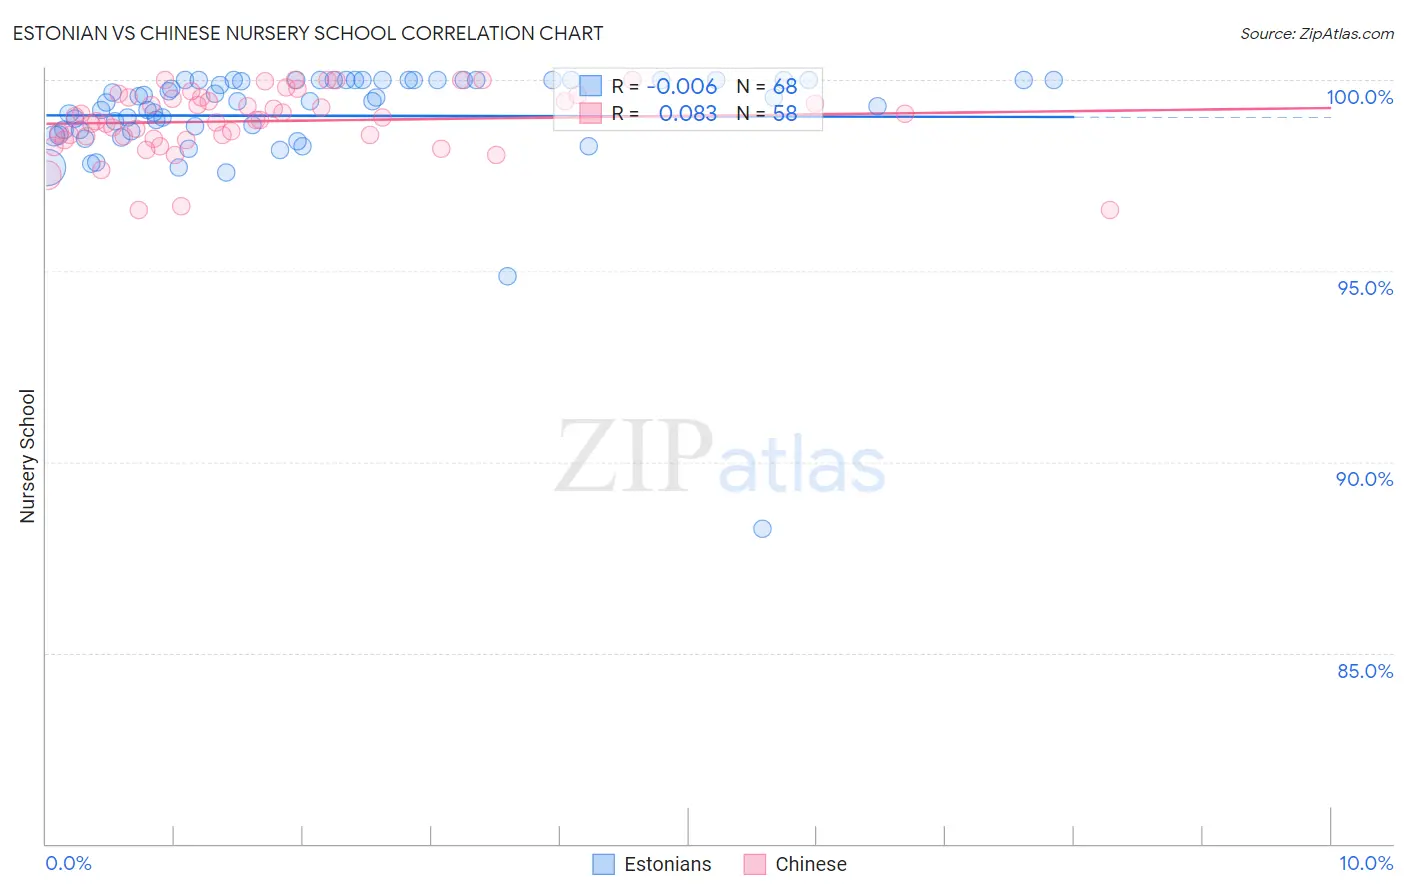
Estonian vs Chinese Nursery School Correlation Chart
The statistical analysis conducted on geographies consisting of 123,528,404 people shows no correlation between the proportion of Estonians and percentage of population with at least nursery school education in the United States with a correlation coefficient (R) of -0.006 and weighted average of 98.5%. Similarly, the statistical analysis conducted on geographies consisting of 64,808,307 people shows a slight positive correlation between the proportion of Chinese and percentage of population with at least nursery school education in the United States with a correlation coefficient (R) of 0.083 and weighted average of 98.6%, a difference of 0.12%.
Nursery School Correlation Summary
| Measurement | Estonian | Chinese |
| Minimum | 88.3% | 96.6% |
| Maximum | 100.0% | 100.0% |
| Range | 11.7% | 3.4% |
| Mean | 99.1% | 98.9% |
| Median | 99.4% | 99.0% |
| Interquartile 25% (IQ1) | 98.7% | 98.5% |
| Interquartile 75% (IQ3) | 100.0% | 99.5% |
| Interquartile Range (IQR) | 1.3% | 1.0% |
| Standard Deviation (Sample) | 1.6% | 0.83% |
| Standard Deviation (Population) | 1.6% | 0.82% |
Demographics Similar to Estonians and Chinese by Nursery School
In terms of nursery school, the demographic groups most similar to Estonians are White/Caucasian (98.5%, a difference of 0.0%), Celtic (98.5%, a difference of 0.0%), Australian (98.5%, a difference of 0.0%), Czechoslovakian (98.5%, a difference of 0.010%), and Ottawa (98.5%, a difference of 0.010%). Similarly, the demographic groups most similar to Chinese are Swiss (98.6%, a difference of 0.0%), French Canadian (98.6%, a difference of 0.020%), Scandinavian (98.6%, a difference of 0.020%), British (98.5%, a difference of 0.020%), and Lumbee (98.5%, a difference of 0.040%).
| Demographics | Rating | Rank | Nursery School |
| French Canadians | 100.0 /100 | #32 | Exceptional 98.6% |
| Scandinavians | 100.0 /100 | #33 | Exceptional 98.6% |
| Chinese | 100.0 /100 | #34 | Exceptional 98.6% |
| Swiss | 100.0 /100 | #35 | Exceptional 98.6% |
| British | 100.0 /100 | #36 | Exceptional 98.5% |
| Lumbee | 99.9 /100 | #37 | Exceptional 98.5% |
| Italians | 99.9 /100 | #38 | Exceptional 98.5% |
| Latvians | 99.9 /100 | #39 | Exceptional 98.5% |
| Chippewa | 99.9 /100 | #40 | Exceptional 98.5% |
| Luxembourgers | 99.9 /100 | #41 | Exceptional 98.5% |
| Eastern Europeans | 99.9 /100 | #42 | Exceptional 98.5% |
| Native Hawaiians | 99.9 /100 | #43 | Exceptional 98.5% |
| Belgians | 99.9 /100 | #44 | Exceptional 98.5% |
| Northern Europeans | 99.9 /100 | #45 | Exceptional 98.5% |
| Hungarians | 99.9 /100 | #46 | Exceptional 98.5% |
| Czechoslovakians | 99.9 /100 | #47 | Exceptional 98.5% |
| Ottawa | 99.8 /100 | #48 | Exceptional 98.5% |
| Whites/Caucasians | 99.8 /100 | #49 | Exceptional 98.5% |
| Celtics | 99.8 /100 | #50 | Exceptional 98.5% |
| Estonians | 99.8 /100 | #51 | Exceptional 98.5% |
| Australians | 99.8 /100 | #52 | Exceptional 98.5% |