Immigrants from Lebanon vs Iranian 8th Grade
COMPARE
Immigrants from Lebanon
Iranian
8th Grade
8th Grade Comparison
Immigrants from Lebanon
Iranians
95.4%
8TH GRADE
13.7/ 100
METRIC RATING
209th/ 347
METRIC RANK
96.6%
8TH GRADE
99.7/ 100
METRIC RATING
67th/ 347
METRIC RANK
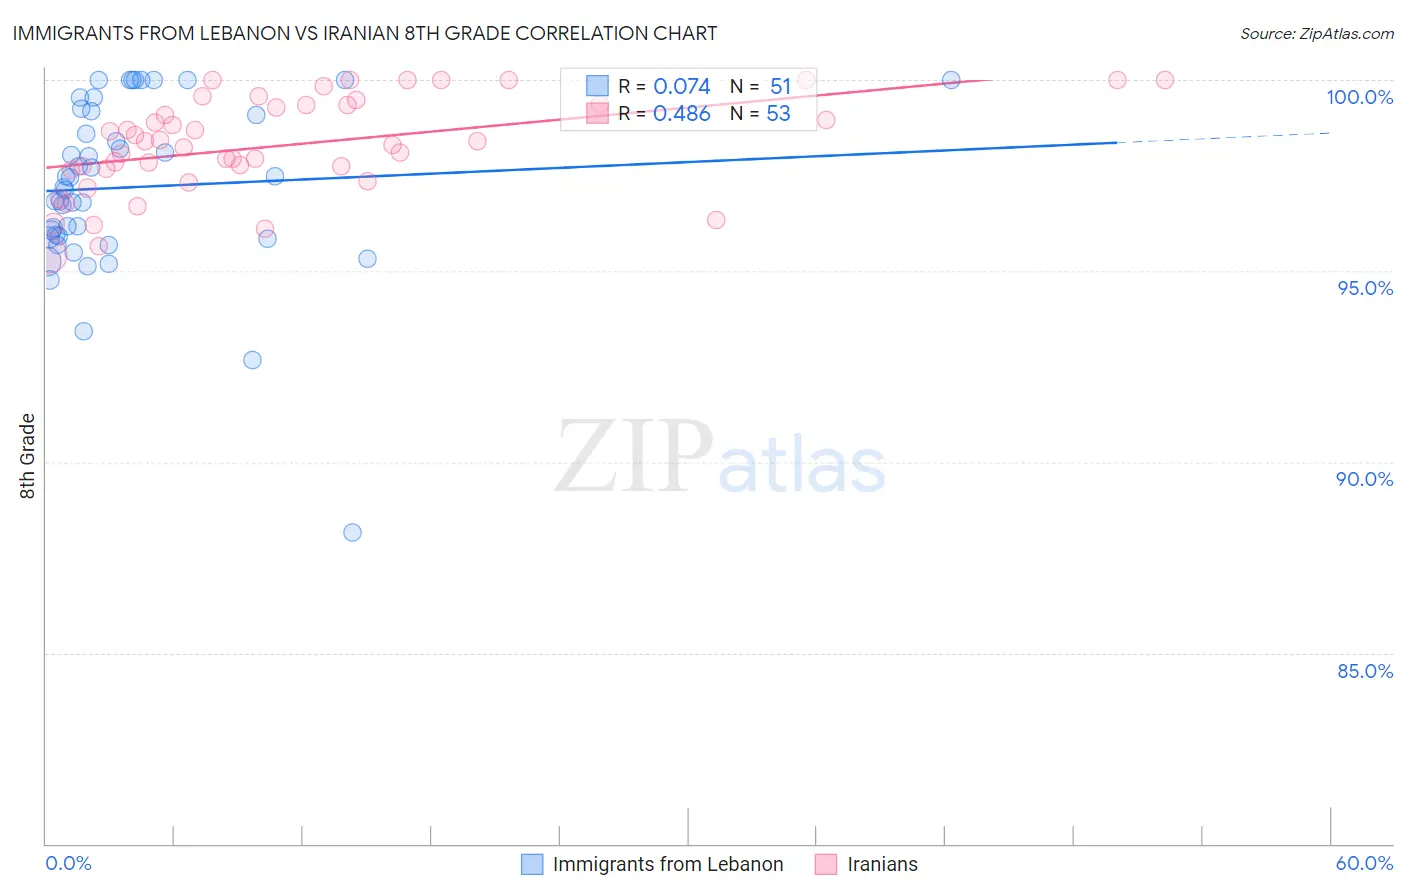
Immigrants from Lebanon vs Iranian 8th Grade Correlation Chart
The statistical analysis conducted on geographies consisting of 217,083,357 people shows a slight positive correlation between the proportion of Immigrants from Lebanon and percentage of population with at least 8th grade education in the United States with a correlation coefficient (R) of 0.074 and weighted average of 95.4%. Similarly, the statistical analysis conducted on geographies consisting of 310,636,461 people shows a moderate positive correlation between the proportion of Iranians and percentage of population with at least 8th grade education in the United States with a correlation coefficient (R) of 0.486 and weighted average of 96.6%, a difference of 1.2%.
8th Grade Correlation Summary
| Measurement | Immigrants from Lebanon | Iranian |
| Minimum | 88.2% | 95.4% |
| Maximum | 100.0% | 100.0% |
| Range | 11.8% | 4.6% |
| Mean | 97.2% | 98.3% |
| Median | 97.2% | 98.4% |
| Interquartile 25% (IQ1) | 95.9% | 97.7% |
| Interquartile 75% (IQ3) | 99.2% | 99.4% |
| Interquartile Range (IQR) | 3.3% | 1.7% |
| Standard Deviation (Sample) | 2.3% | 1.3% |
| Standard Deviation (Population) | 2.3% | 1.2% |
Similar Demographics by 8th Grade
Demographics Similar to Immigrants from Lebanon by 8th Grade
In terms of 8th grade, the demographic groups most similar to Immigrants from Lebanon are African (95.4%, a difference of 0.0%), Portuguese (95.5%, a difference of 0.010%), Immigrants from Sudan (95.5%, a difference of 0.020%), Immigrants from Morocco (95.4%, a difference of 0.020%), and Comanche (95.5%, a difference of 0.030%).
| Demographics | Rating | Rank | 8th Grade |
| Apache | 19.4 /100 | #202 | Poor 95.5% |
| Moroccans | 17.4 /100 | #203 | Poor 95.5% |
| Hawaiians | 16.7 /100 | #204 | Poor 95.5% |
| Immigrants | Bahamas | 16.7 /100 | #205 | Poor 95.5% |
| Comanche | 16.3 /100 | #206 | Poor 95.5% |
| Immigrants | Sudan | 15.1 /100 | #207 | Poor 95.5% |
| Portuguese | 14.3 /100 | #208 | Poor 95.5% |
| Immigrants | Lebanon | 13.7 /100 | #209 | Poor 95.4% |
| Africans | 13.6 /100 | #210 | Poor 95.4% |
| Immigrants | Morocco | 12.4 /100 | #211 | Poor 95.4% |
| Immigrants | Pakistan | 9.7 /100 | #212 | Tragic 95.4% |
| Laotians | 9.0 /100 | #213 | Tragic 95.4% |
| Immigrants | Chile | 9.0 /100 | #214 | Tragic 95.4% |
| Immigrants | Liberia | 8.9 /100 | #215 | Tragic 95.4% |
| Samoans | 8.4 /100 | #216 | Tragic 95.4% |
Demographics Similar to Iranians by 8th Grade
In terms of 8th grade, the demographic groups most similar to Iranians are Ukrainian (96.7%, a difference of 0.010%), Immigrants from India (96.6%, a difference of 0.010%), Native Hawaiian (96.6%, a difference of 0.010%), Canadian (96.6%, a difference of 0.010%), and Creek (96.6%, a difference of 0.010%).
| Demographics | Rating | Rank | 8th Grade |
| Immigrants | Northern Europe | 99.8 /100 | #60 | Exceptional 96.7% |
| Immigrants | Austria | 99.8 /100 | #61 | Exceptional 96.7% |
| Whites/Caucasians | 99.8 /100 | #62 | Exceptional 96.7% |
| Ukrainians | 99.7 /100 | #63 | Exceptional 96.7% |
| Immigrants | India | 99.7 /100 | #64 | Exceptional 96.6% |
| Native Hawaiians | 99.7 /100 | #65 | Exceptional 96.6% |
| Canadians | 99.7 /100 | #66 | Exceptional 96.6% |
| Iranians | 99.7 /100 | #67 | Exceptional 96.6% |
| Creek | 99.7 /100 | #68 | Exceptional 96.6% |
| Americans | 99.7 /100 | #69 | Exceptional 96.6% |
| Immigrants | Lithuania | 99.6 /100 | #70 | Exceptional 96.6% |
| New Zealanders | 99.5 /100 | #71 | Exceptional 96.6% |
| Immigrants | England | 99.5 /100 | #72 | Exceptional 96.6% |
| Arapaho | 99.5 /100 | #73 | Exceptional 96.6% |
| Immigrants | Ireland | 99.5 /100 | #74 | Exceptional 96.5% |