Immigrants from Lebanon vs Immigrants from Sudan 3rd Grade
COMPARE
Immigrants from Lebanon
Immigrants from Sudan
3rd Grade
3rd Grade Comparison
Immigrants from Lebanon
Immigrants from Sudan
97.7%
3RD GRADE
21.7/ 100
METRIC RATING
201st/ 347
METRIC RANK
97.5%
3RD GRADE
3.4/ 100
METRIC RATING
227th/ 347
METRIC RANK
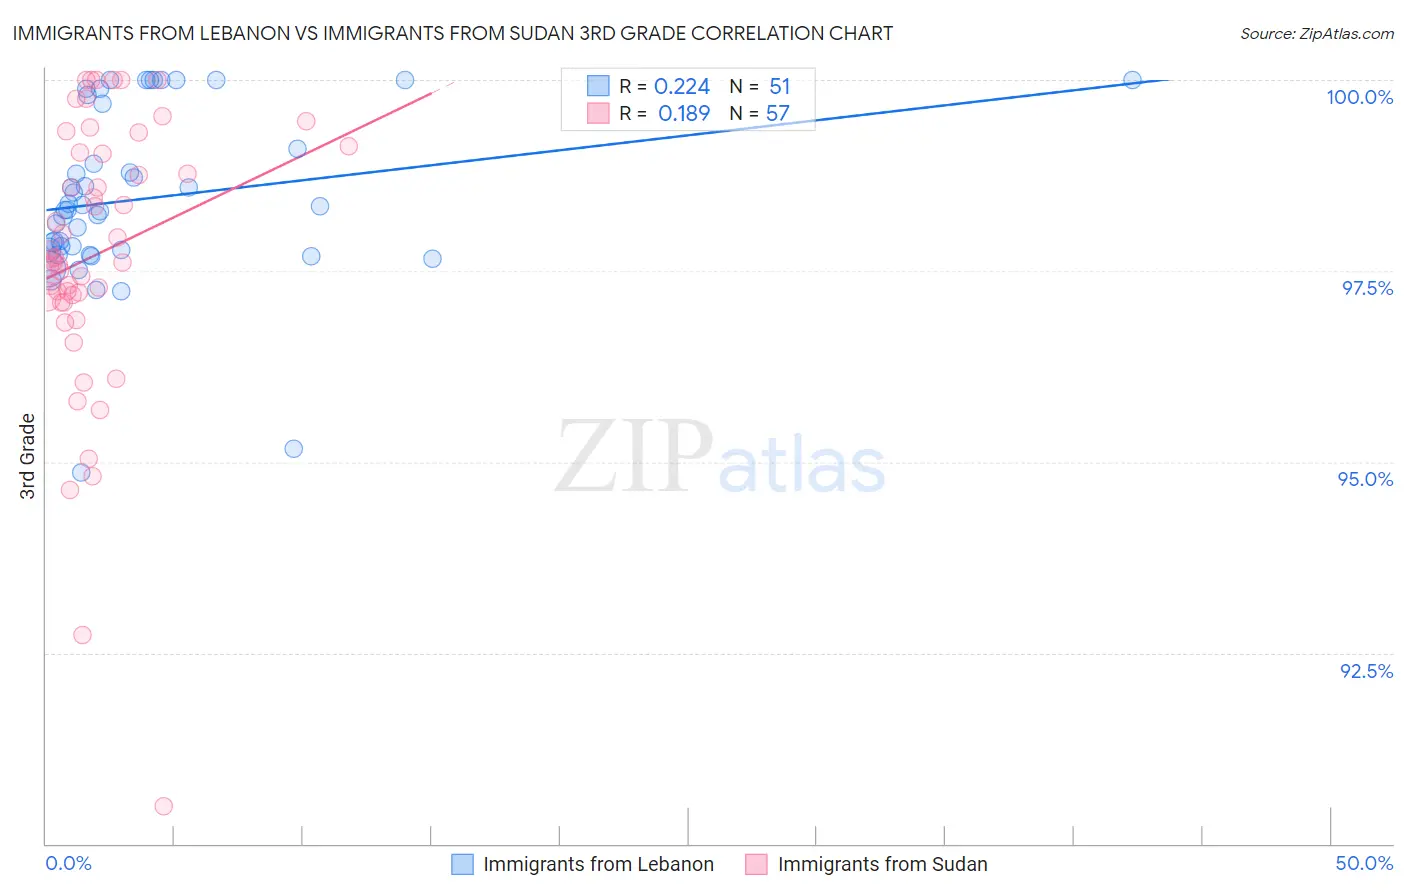
Immigrants from Lebanon vs Immigrants from Sudan 3rd Grade Correlation Chart
The statistical analysis conducted on geographies consisting of 217,102,284 people shows a weak positive correlation between the proportion of Immigrants from Lebanon and percentage of population with at least 3rd grade education in the United States with a correlation coefficient (R) of 0.224 and weighted average of 97.7%. Similarly, the statistical analysis conducted on geographies consisting of 118,965,188 people shows a poor positive correlation between the proportion of Immigrants from Sudan and percentage of population with at least 3rd grade education in the United States with a correlation coefficient (R) of 0.189 and weighted average of 97.5%, a difference of 0.17%.
3rd Grade Correlation Summary
| Measurement | Immigrants from Lebanon | Immigrants from Sudan |
| Minimum | 94.9% | 90.5% |
| Maximum | 100.0% | 100.0% |
| Range | 5.1% | 9.5% |
| Mean | 98.4% | 97.7% |
| Median | 98.3% | 97.7% |
| Interquartile 25% (IQ1) | 97.8% | 97.1% |
| Interquartile 75% (IQ3) | 99.7% | 99.1% |
| Interquartile Range (IQR) | 1.9% | 2.0% |
| Standard Deviation (Sample) | 1.1% | 1.8% |
| Standard Deviation (Population) | 1.1% | 1.8% |
Similar Demographics by 3rd Grade
Demographics Similar to Immigrants from Lebanon by 3rd Grade
In terms of 3rd grade, the demographic groups most similar to Immigrants from Lebanon are Immigrants from Albania (97.7%, a difference of 0.0%), Guamanian/Chamorro (97.7%, a difference of 0.010%), Immigrants from Ukraine (97.7%, a difference of 0.010%), Immigrants from Egypt (97.7%, a difference of 0.020%), and Paraguayan (97.7%, a difference of 0.020%).
| Demographics | Rating | Rank | 3rd Grade |
| Immigrants | Uganda | 27.4 /100 | #194 | Fair 97.7% |
| Immigrants | Egypt | 26.8 /100 | #195 | Fair 97.7% |
| Paraguayans | 26.2 /100 | #196 | Fair 97.7% |
| Hawaiians | 25.7 /100 | #197 | Fair 97.7% |
| Guamanians/Chamorros | 23.6 /100 | #198 | Fair 97.7% |
| Immigrants | Ukraine | 22.7 /100 | #199 | Fair 97.7% |
| Immigrants | Albania | 22.6 /100 | #200 | Fair 97.7% |
| Immigrants | Lebanon | 21.7 /100 | #201 | Fair 97.7% |
| Immigrants | Southern Europe | 17.7 /100 | #202 | Poor 97.6% |
| Paiute | 16.7 /100 | #203 | Poor 97.6% |
| Immigrants | Chile | 16.5 /100 | #204 | Poor 97.6% |
| Africans | 14.5 /100 | #205 | Poor 97.6% |
| Immigrants | Northern Africa | 13.0 /100 | #206 | Poor 97.6% |
| Tohono O'odham | 12.5 /100 | #207 | Poor 97.6% |
| Immigrants | Zaire | 11.9 /100 | #208 | Poor 97.6% |
Demographics Similar to Immigrants from Sudan by 3rd Grade
In terms of 3rd grade, the demographic groups most similar to Immigrants from Sudan are Subsaharan African (97.5%, a difference of 0.010%), Senegalese (97.5%, a difference of 0.010%), Immigrants from Syria (97.5%, a difference of 0.020%), Bahamian (97.5%, a difference of 0.020%), and Tongan (97.5%, a difference of 0.020%).
| Demographics | Rating | Rank | 3rd Grade |
| Immigrants | Morocco | 5.0 /100 | #220 | Tragic 97.5% |
| Uruguayans | 5.0 /100 | #221 | Tragic 97.5% |
| Sierra Leoneans | 4.6 /100 | #222 | Tragic 97.5% |
| Immigrants | Syria | 4.4 /100 | #223 | Tragic 97.5% |
| Bahamians | 4.4 /100 | #224 | Tragic 97.5% |
| Tongans | 4.3 /100 | #225 | Tragic 97.5% |
| Sudanese | 4.1 /100 | #226 | Tragic 97.5% |
| Immigrants | Sudan | 3.4 /100 | #227 | Tragic 97.5% |
| Sub-Saharan Africans | 3.2 /100 | #228 | Tragic 97.5% |
| Senegalese | 3.0 /100 | #229 | Tragic 97.5% |
| Immigrants | Pakistan | 2.7 /100 | #230 | Tragic 97.5% |
| Immigrants | Costa Rica | 2.7 /100 | #231 | Tragic 97.5% |
| Immigrants | Western Asia | 2.6 /100 | #232 | Tragic 97.5% |
| Immigrants | Malaysia | 2.4 /100 | #233 | Tragic 97.5% |
| Immigrants | Eastern Asia | 1.9 /100 | #234 | Tragic 97.4% |