Immigrants from Lebanon vs Albanian 3rd Grade
COMPARE
Immigrants from Lebanon
Albanian
3rd Grade
3rd Grade Comparison
Immigrants from Lebanon
Albanians
97.7%
3RD GRADE
21.7/ 100
METRIC RATING
201st/ 347
METRIC RANK
97.8%
3RD GRADE
58.8/ 100
METRIC RATING
161st/ 347
METRIC RANK
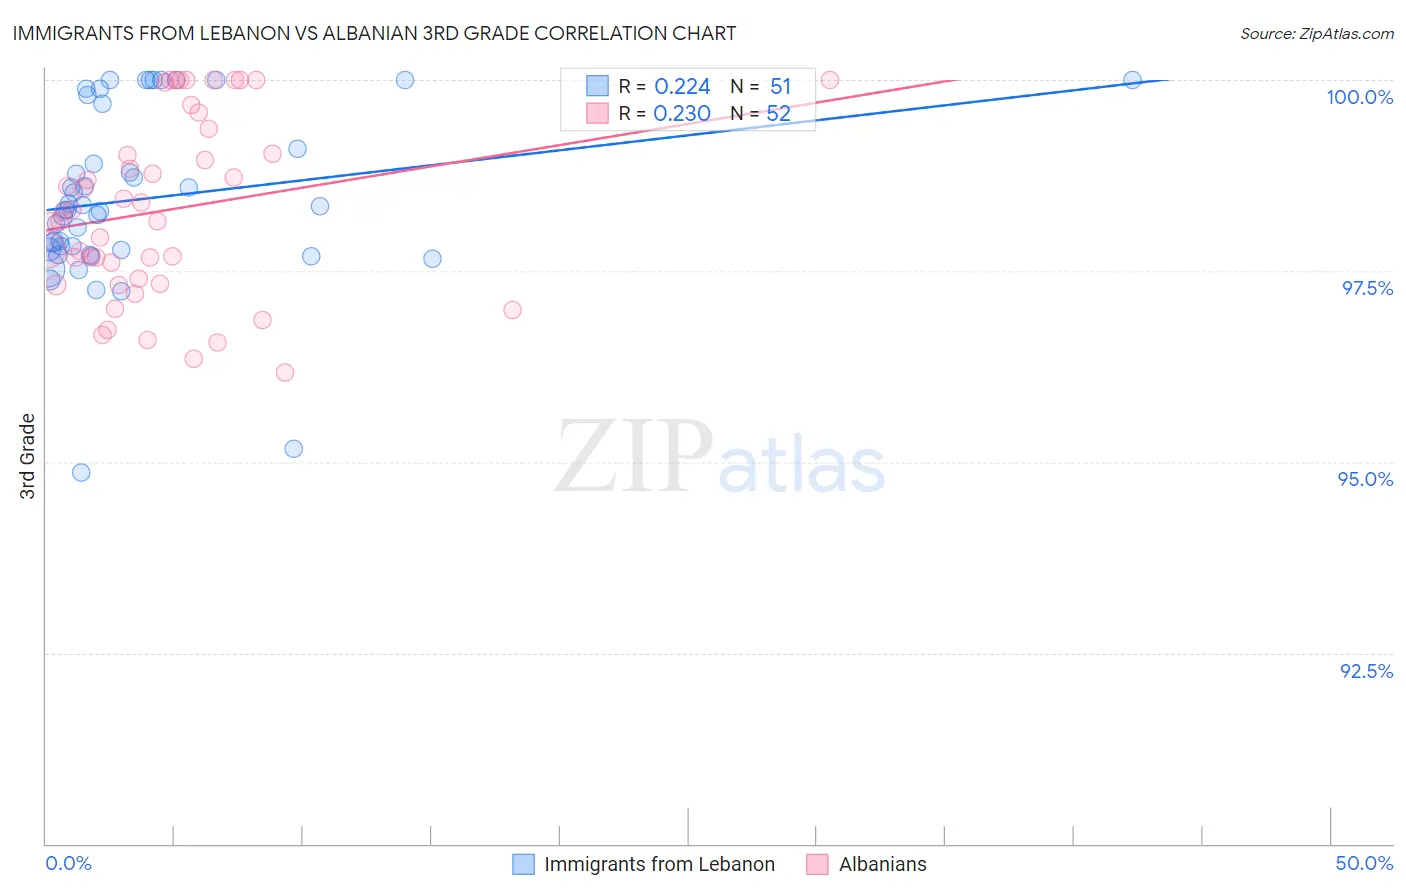
Immigrants from Lebanon vs Albanian 3rd Grade Correlation Chart
The statistical analysis conducted on geographies consisting of 217,102,284 people shows a weak positive correlation between the proportion of Immigrants from Lebanon and percentage of population with at least 3rd grade education in the United States with a correlation coefficient (R) of 0.224 and weighted average of 97.7%. Similarly, the statistical analysis conducted on geographies consisting of 193,265,850 people shows a weak positive correlation between the proportion of Albanians and percentage of population with at least 3rd grade education in the United States with a correlation coefficient (R) of 0.230 and weighted average of 97.8%, a difference of 0.14%.
3rd Grade Correlation Summary
| Measurement | Immigrants from Lebanon | Albanian |
| Minimum | 94.9% | 96.2% |
| Maximum | 100.0% | 100.0% |
| Range | 5.1% | 3.8% |
| Mean | 98.4% | 98.3% |
| Median | 98.3% | 98.2% |
| Interquartile 25% (IQ1) | 97.8% | 97.4% |
| Interquartile 75% (IQ3) | 99.7% | 99.2% |
| Interquartile Range (IQR) | 1.9% | 1.8% |
| Standard Deviation (Sample) | 1.1% | 1.2% |
| Standard Deviation (Population) | 1.1% | 1.2% |
Similar Demographics by 3rd Grade
Demographics Similar to Immigrants from Lebanon by 3rd Grade
In terms of 3rd grade, the demographic groups most similar to Immigrants from Lebanon are Immigrants from Albania (97.7%, a difference of 0.0%), Guamanian/Chamorro (97.7%, a difference of 0.010%), Immigrants from Ukraine (97.7%, a difference of 0.010%), Immigrants from Egypt (97.7%, a difference of 0.020%), and Paraguayan (97.7%, a difference of 0.020%).
| Demographics | Rating | Rank | 3rd Grade |
| Immigrants | Uganda | 27.4 /100 | #194 | Fair 97.7% |
| Immigrants | Egypt | 26.8 /100 | #195 | Fair 97.7% |
| Paraguayans | 26.2 /100 | #196 | Fair 97.7% |
| Hawaiians | 25.7 /100 | #197 | Fair 97.7% |
| Guamanians/Chamorros | 23.6 /100 | #198 | Fair 97.7% |
| Immigrants | Ukraine | 22.7 /100 | #199 | Fair 97.7% |
| Immigrants | Albania | 22.6 /100 | #200 | Fair 97.7% |
| Immigrants | Lebanon | 21.7 /100 | #201 | Fair 97.7% |
| Immigrants | Southern Europe | 17.7 /100 | #202 | Poor 97.6% |
| Paiute | 16.7 /100 | #203 | Poor 97.6% |
| Immigrants | Chile | 16.5 /100 | #204 | Poor 97.6% |
| Africans | 14.5 /100 | #205 | Poor 97.6% |
| Immigrants | Northern Africa | 13.0 /100 | #206 | Poor 97.6% |
| Tohono O'odham | 12.5 /100 | #207 | Poor 97.6% |
| Immigrants | Zaire | 11.9 /100 | #208 | Poor 97.6% |
Demographics Similar to Albanians by 3rd Grade
In terms of 3rd grade, the demographic groups most similar to Albanians are French American Indian (97.8%, a difference of 0.0%), Immigrants from Iran (97.8%, a difference of 0.0%), Immigrants from Jordan (97.8%, a difference of 0.0%), Bermudan (97.8%, a difference of 0.010%), and Immigrants from Russia (97.8%, a difference of 0.010%).
| Demographics | Rating | Rank | 3rd Grade |
| Immigrants | Eastern Europe | 64.1 /100 | #154 | Good 97.8% |
| Bermudans | 62.6 /100 | #155 | Good 97.8% |
| Immigrants | Russia | 61.7 /100 | #156 | Good 97.8% |
| Immigrants | Italy | 61.2 /100 | #157 | Good 97.8% |
| Venezuelans | 60.9 /100 | #158 | Good 97.8% |
| French American Indians | 60.0 /100 | #159 | Average 97.8% |
| Immigrants | Iran | 59.1 /100 | #160 | Average 97.8% |
| Albanians | 58.8 /100 | #161 | Average 97.8% |
| Immigrants | Jordan | 57.9 /100 | #162 | Average 97.8% |
| Marshallese | 57.2 /100 | #163 | Average 97.8% |
| Immigrants | Bosnia and Herzegovina | 56.2 /100 | #164 | Average 97.8% |
| Ugandans | 56.1 /100 | #165 | Average 97.8% |
| Dutch West Indians | 55.5 /100 | #166 | Average 97.8% |
| Chileans | 55.3 /100 | #167 | Average 97.8% |
| Immigrants | Spain | 54.3 /100 | #168 | Average 97.8% |