Immigrants from Lebanon vs Dutch 3rd Grade
COMPARE
Immigrants from Lebanon
Dutch
3rd Grade
3rd Grade Comparison
Immigrants from Lebanon
Dutch
97.7%
3RD GRADE
21.7/ 100
METRIC RATING
201st/ 347
METRIC RANK
98.5%
3RD GRADE
100.0/ 100
METRIC RATING
17th/ 347
METRIC RANK
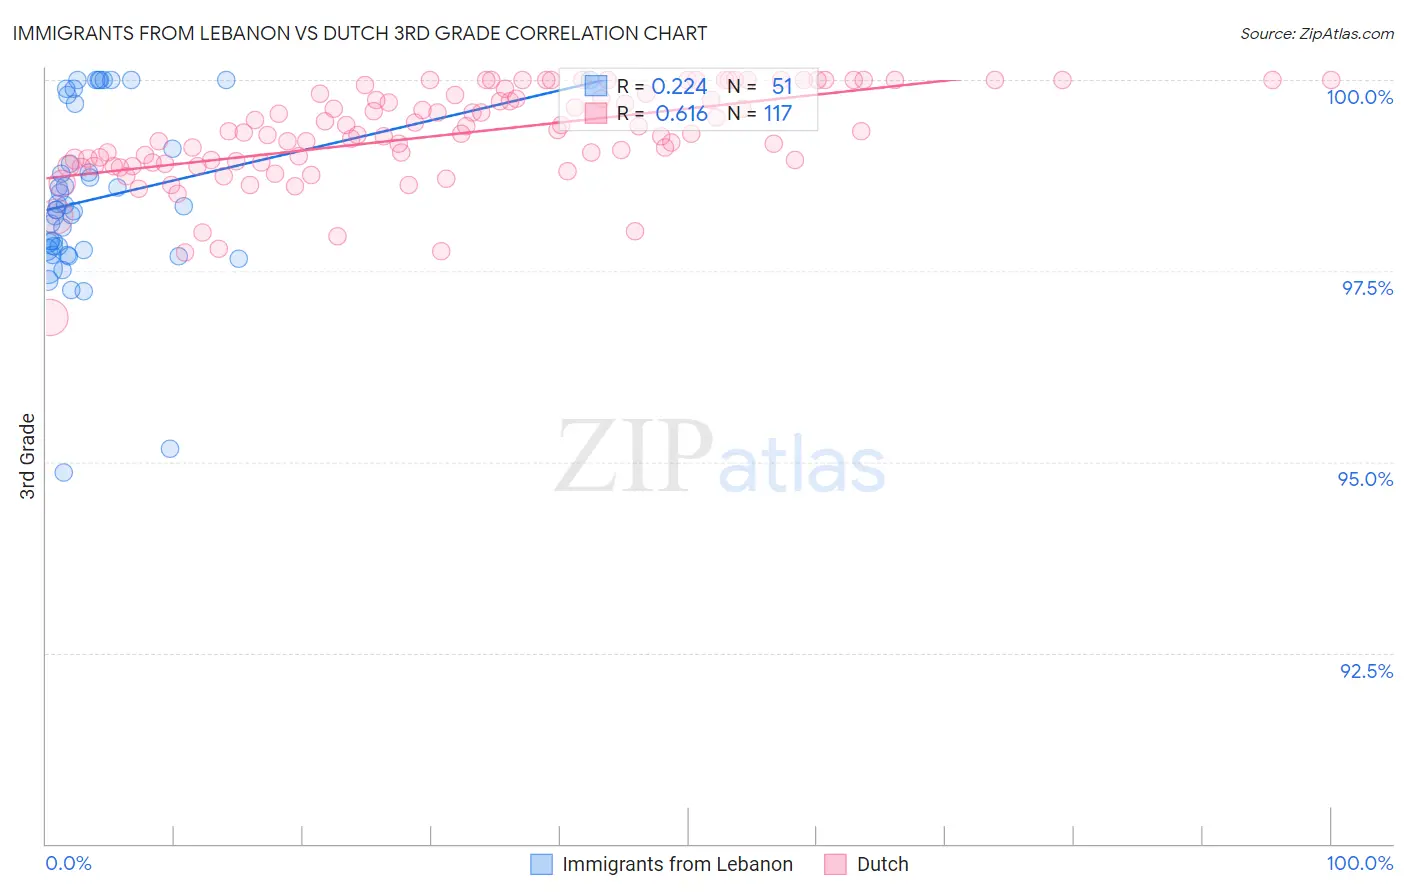
Immigrants from Lebanon vs Dutch 3rd Grade Correlation Chart
The statistical analysis conducted on geographies consisting of 217,102,284 people shows a weak positive correlation between the proportion of Immigrants from Lebanon and percentage of population with at least 3rd grade education in the United States with a correlation coefficient (R) of 0.224 and weighted average of 97.7%. Similarly, the statistical analysis conducted on geographies consisting of 554,359,260 people shows a significant positive correlation between the proportion of Dutch and percentage of population with at least 3rd grade education in the United States with a correlation coefficient (R) of 0.616 and weighted average of 98.5%, a difference of 0.88%.
3rd Grade Correlation Summary
| Measurement | Immigrants from Lebanon | Dutch |
| Minimum | 94.9% | 96.9% |
| Maximum | 100.0% | 100.0% |
| Range | 5.1% | 3.1% |
| Mean | 98.4% | 99.3% |
| Median | 98.3% | 99.3% |
| Interquartile 25% (IQ1) | 97.8% | 98.9% |
| Interquartile 75% (IQ3) | 99.7% | 99.8% |
| Interquartile Range (IQR) | 1.9% | 0.91% |
| Standard Deviation (Sample) | 1.1% | 0.61% |
| Standard Deviation (Population) | 1.1% | 0.61% |
Similar Demographics by 3rd Grade
Demographics Similar to Immigrants from Lebanon by 3rd Grade
In terms of 3rd grade, the demographic groups most similar to Immigrants from Lebanon are Immigrants from Albania (97.7%, a difference of 0.0%), Guamanian/Chamorro (97.7%, a difference of 0.010%), Immigrants from Ukraine (97.7%, a difference of 0.010%), Immigrants from Egypt (97.7%, a difference of 0.020%), and Paraguayan (97.7%, a difference of 0.020%).
| Demographics | Rating | Rank | 3rd Grade |
| Immigrants | Uganda | 27.4 /100 | #194 | Fair 97.7% |
| Immigrants | Egypt | 26.8 /100 | #195 | Fair 97.7% |
| Paraguayans | 26.2 /100 | #196 | Fair 97.7% |
| Hawaiians | 25.7 /100 | #197 | Fair 97.7% |
| Guamanians/Chamorros | 23.6 /100 | #198 | Fair 97.7% |
| Immigrants | Ukraine | 22.7 /100 | #199 | Fair 97.7% |
| Immigrants | Albania | 22.6 /100 | #200 | Fair 97.7% |
| Immigrants | Lebanon | 21.7 /100 | #201 | Fair 97.7% |
| Immigrants | Southern Europe | 17.7 /100 | #202 | Poor 97.6% |
| Paiute | 16.7 /100 | #203 | Poor 97.6% |
| Immigrants | Chile | 16.5 /100 | #204 | Poor 97.6% |
| Africans | 14.5 /100 | #205 | Poor 97.6% |
| Immigrants | Northern Africa | 13.0 /100 | #206 | Poor 97.6% |
| Tohono O'odham | 12.5 /100 | #207 | Poor 97.6% |
| Immigrants | Zaire | 11.9 /100 | #208 | Poor 97.6% |
Demographics Similar to Dutch by 3rd Grade
In terms of 3rd grade, the demographic groups most similar to Dutch are Scottish (98.5%, a difference of 0.010%), Irish (98.5%, a difference of 0.010%), Polish (98.5%, a difference of 0.020%), Pennsylvania German (98.5%, a difference of 0.020%), and Swedish (98.5%, a difference of 0.030%).
| Demographics | Rating | Rank | 3rd Grade |
| Alaska Natives | 100.0 /100 | #10 | Exceptional 98.6% |
| Slovenes | 100.0 /100 | #11 | Exceptional 98.6% |
| English | 100.0 /100 | #12 | Exceptional 98.6% |
| Tlingit-Haida | 100.0 /100 | #13 | Exceptional 98.5% |
| Carpatho Rusyns | 100.0 /100 | #14 | Exceptional 98.5% |
| Swedes | 100.0 /100 | #15 | Exceptional 98.5% |
| Scottish | 100.0 /100 | #16 | Exceptional 98.5% |
| Dutch | 100.0 /100 | #17 | Exceptional 98.5% |
| Irish | 100.0 /100 | #18 | Exceptional 98.5% |
| Poles | 100.0 /100 | #19 | Exceptional 98.5% |
| Pennsylvania Germans | 100.0 /100 | #20 | Exceptional 98.5% |
| Lithuanians | 100.0 /100 | #21 | Exceptional 98.5% |
| Finns | 100.0 /100 | #22 | Exceptional 98.5% |
| Sioux | 100.0 /100 | #23 | Exceptional 98.5% |
| Danes | 100.0 /100 | #24 | Exceptional 98.5% |