Immigrants from Lebanon vs Immigrants from the Azores 3rd Grade
COMPARE
Immigrants from Lebanon
Immigrants from the Azores
3rd Grade
3rd Grade Comparison
Immigrants from Lebanon
Immigrants from the Azores
97.7%
3RD GRADE
21.7/ 100
METRIC RATING
201st/ 347
METRIC RANK
96.6%
3RD GRADE
0.0/ 100
METRIC RATING
315th/ 347
METRIC RANK
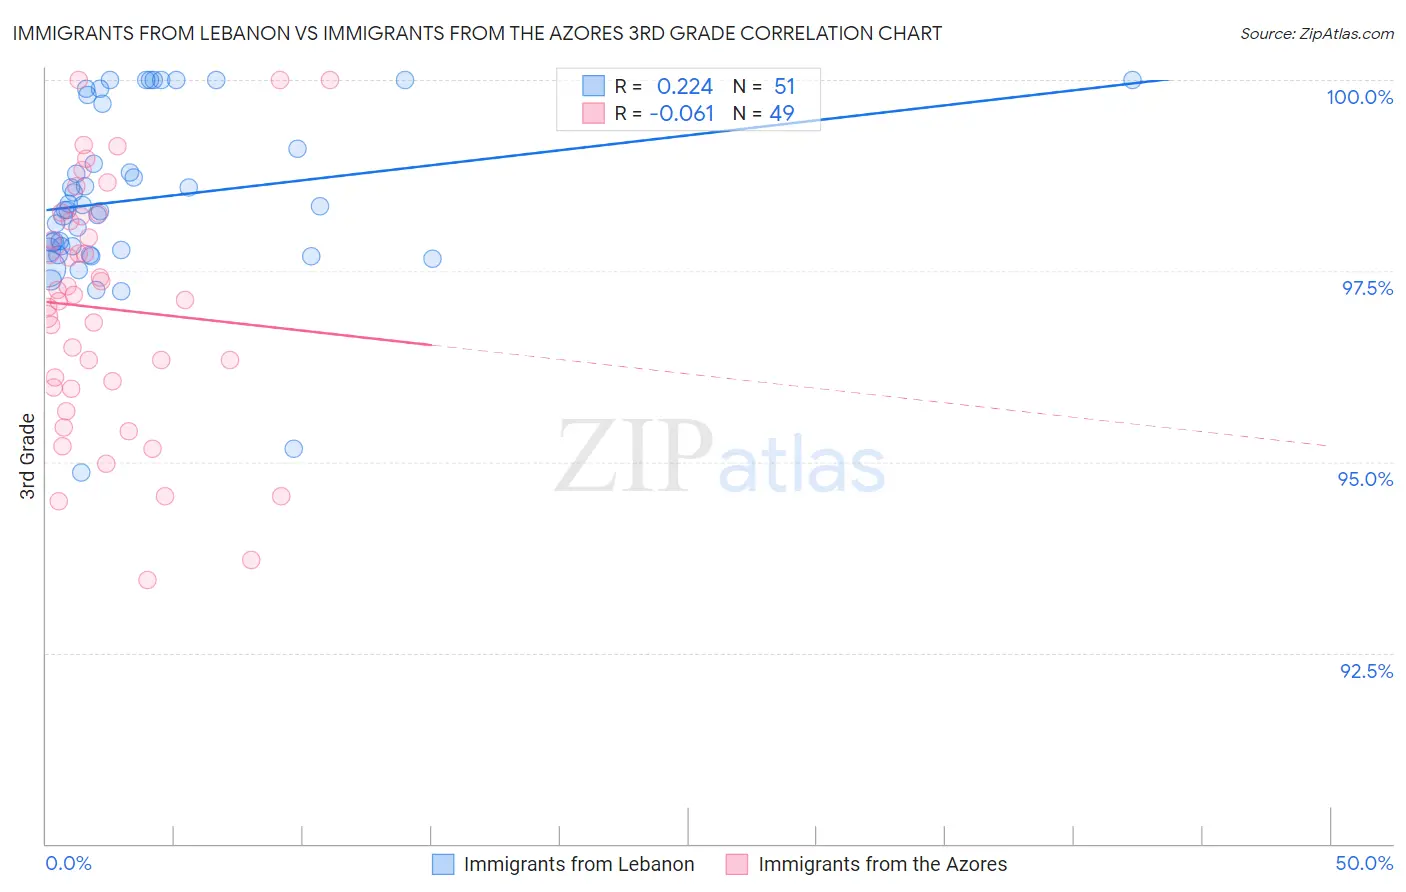
Immigrants from Lebanon vs Immigrants from the Azores 3rd Grade Correlation Chart
The statistical analysis conducted on geographies consisting of 217,102,284 people shows a weak positive correlation between the proportion of Immigrants from Lebanon and percentage of population with at least 3rd grade education in the United States with a correlation coefficient (R) of 0.224 and weighted average of 97.7%. Similarly, the statistical analysis conducted on geographies consisting of 46,257,310 people shows a slight negative correlation between the proportion of Immigrants from the Azores and percentage of population with at least 3rd grade education in the United States with a correlation coefficient (R) of -0.061 and weighted average of 96.6%, a difference of 1.1%.
3rd Grade Correlation Summary
| Measurement | Immigrants from Lebanon | Immigrants from the Azores |
| Minimum | 94.9% | 93.4% |
| Maximum | 100.0% | 100.0% |
| Range | 5.1% | 6.6% |
| Mean | 98.4% | 97.0% |
| Median | 98.3% | 97.1% |
| Interquartile 25% (IQ1) | 97.8% | 96.0% |
| Interquartile 75% (IQ3) | 99.7% | 98.2% |
| Interquartile Range (IQR) | 1.9% | 2.2% |
| Standard Deviation (Sample) | 1.1% | 1.6% |
| Standard Deviation (Population) | 1.1% | 1.6% |
Similar Demographics by 3rd Grade
Demographics Similar to Immigrants from Lebanon by 3rd Grade
In terms of 3rd grade, the demographic groups most similar to Immigrants from Lebanon are Immigrants from Albania (97.7%, a difference of 0.0%), Guamanian/Chamorro (97.7%, a difference of 0.010%), Immigrants from Ukraine (97.7%, a difference of 0.010%), Immigrants from Egypt (97.7%, a difference of 0.020%), and Paraguayan (97.7%, a difference of 0.020%).
| Demographics | Rating | Rank | 3rd Grade |
| Immigrants | Uganda | 27.4 /100 | #194 | Fair 97.7% |
| Immigrants | Egypt | 26.8 /100 | #195 | Fair 97.7% |
| Paraguayans | 26.2 /100 | #196 | Fair 97.7% |
| Hawaiians | 25.7 /100 | #197 | Fair 97.7% |
| Guamanians/Chamorros | 23.6 /100 | #198 | Fair 97.7% |
| Immigrants | Ukraine | 22.7 /100 | #199 | Fair 97.7% |
| Immigrants | Albania | 22.6 /100 | #200 | Fair 97.7% |
| Immigrants | Lebanon | 21.7 /100 | #201 | Fair 97.7% |
| Immigrants | Southern Europe | 17.7 /100 | #202 | Poor 97.6% |
| Paiute | 16.7 /100 | #203 | Poor 97.6% |
| Immigrants | Chile | 16.5 /100 | #204 | Poor 97.6% |
| Africans | 14.5 /100 | #205 | Poor 97.6% |
| Immigrants | Northern Africa | 13.0 /100 | #206 | Poor 97.6% |
| Tohono O'odham | 12.5 /100 | #207 | Poor 97.6% |
| Immigrants | Zaire | 11.9 /100 | #208 | Poor 97.6% |
Demographics Similar to Immigrants from the Azores by 3rd Grade
In terms of 3rd grade, the demographic groups most similar to Immigrants from the Azores are Immigrants from Ecuador (96.6%, a difference of 0.010%), Belizean (96.6%, a difference of 0.010%), Immigrants from Burma/Myanmar (96.6%, a difference of 0.010%), Immigrants from Laos (96.6%, a difference of 0.020%), and Immigrants from Bangladesh (96.6%, a difference of 0.030%).
| Demographics | Rating | Rank | 3rd Grade |
| Immigrants | Haiti | 0.0 /100 | #308 | Tragic 96.7% |
| Sri Lankans | 0.0 /100 | #309 | Tragic 96.7% |
| Cape Verdeans | 0.0 /100 | #310 | Tragic 96.6% |
| Immigrants | Guyana | 0.0 /100 | #311 | Tragic 96.6% |
| Immigrants | Laos | 0.0 /100 | #312 | Tragic 96.6% |
| Immigrants | Ecuador | 0.0 /100 | #313 | Tragic 96.6% |
| Belizeans | 0.0 /100 | #314 | Tragic 96.6% |
| Immigrants | Azores | 0.0 /100 | #315 | Tragic 96.6% |
| Immigrants | Burma/Myanmar | 0.0 /100 | #316 | Tragic 96.6% |
| Immigrants | Bangladesh | 0.0 /100 | #317 | Tragic 96.6% |
| Hispanics or Latinos | 0.0 /100 | #318 | Tragic 96.5% |
| Vietnamese | 0.0 /100 | #319 | Tragic 96.5% |
| Immigrants | Nicaragua | 0.0 /100 | #320 | Tragic 96.5% |
| Indonesians | 0.0 /100 | #321 | Tragic 96.5% |
| Immigrants | Belize | 0.0 /100 | #322 | Tragic 96.5% |