Immigrants from Hungary vs Immigrants from Sudan 3rd Grade
COMPARE
Immigrants from Hungary
Immigrants from Sudan
3rd Grade
3rd Grade Comparison
Immigrants from Hungary
Immigrants from Sudan
97.9%
3RD GRADE
88.8/ 100
METRIC RATING
132nd/ 347
METRIC RANK
97.5%
3RD GRADE
3.4/ 100
METRIC RATING
227th/ 347
METRIC RANK
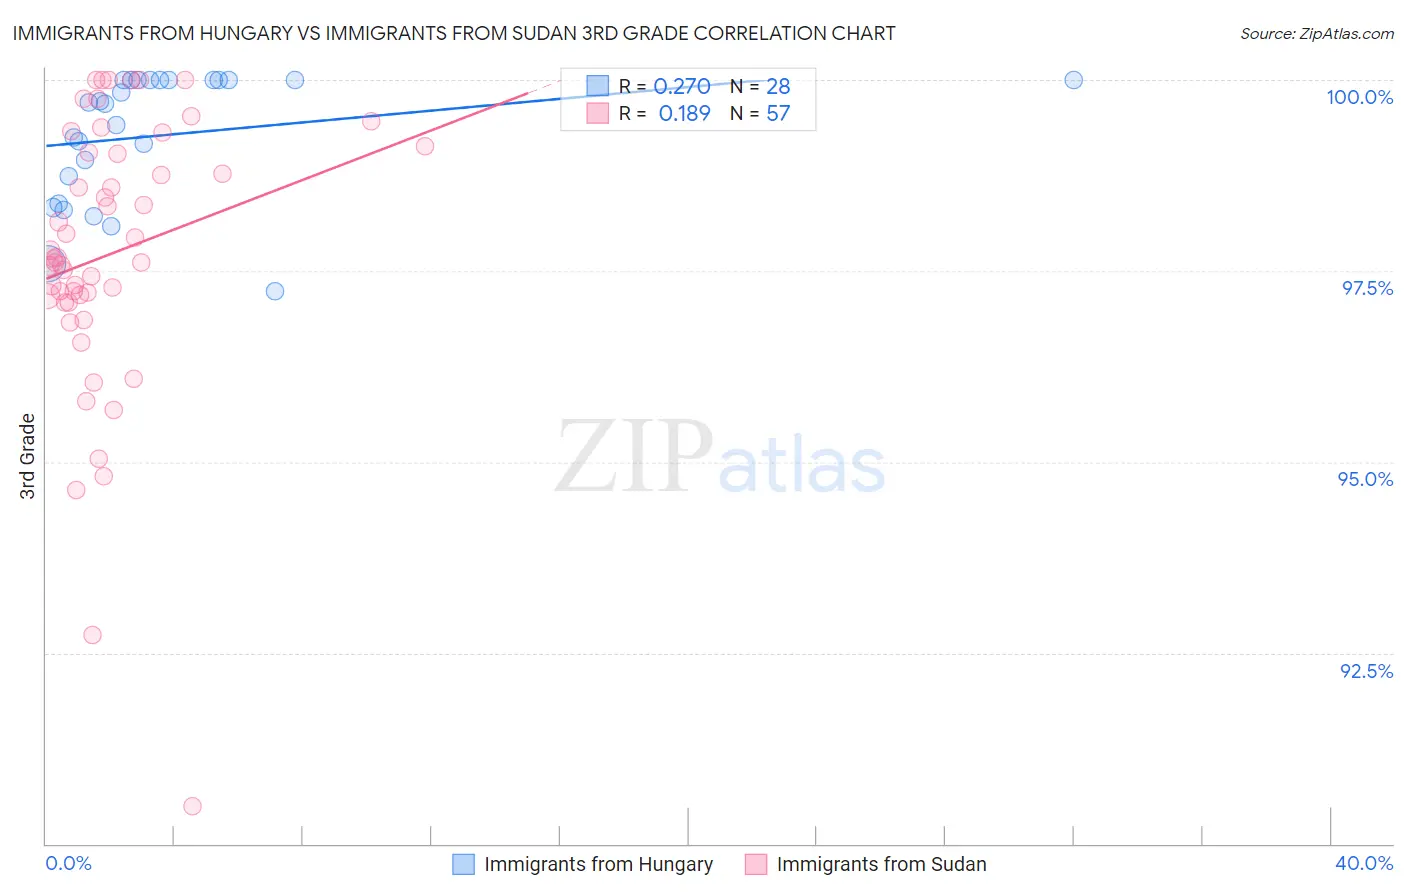
Immigrants from Hungary vs Immigrants from Sudan 3rd Grade Correlation Chart
The statistical analysis conducted on geographies consisting of 195,707,305 people shows a weak positive correlation between the proportion of Immigrants from Hungary and percentage of population with at least 3rd grade education in the United States with a correlation coefficient (R) of 0.270 and weighted average of 97.9%. Similarly, the statistical analysis conducted on geographies consisting of 118,965,188 people shows a poor positive correlation between the proportion of Immigrants from Sudan and percentage of population with at least 3rd grade education in the United States with a correlation coefficient (R) of 0.189 and weighted average of 97.5%, a difference of 0.46%.
3rd Grade Correlation Summary
| Measurement | Immigrants from Hungary | Immigrants from Sudan |
| Minimum | 97.2% | 90.5% |
| Maximum | 100.0% | 100.0% |
| Range | 2.8% | 9.5% |
| Mean | 99.3% | 97.7% |
| Median | 99.7% | 97.7% |
| Interquartile 25% (IQ1) | 98.6% | 97.1% |
| Interquartile 75% (IQ3) | 100.0% | 99.1% |
| Interquartile Range (IQR) | 1.4% | 2.0% |
| Standard Deviation (Sample) | 0.84% | 1.8% |
| Standard Deviation (Population) | 0.83% | 1.8% |
Similar Demographics by 3rd Grade
Demographics Similar to Immigrants from Hungary by 3rd Grade
In terms of 3rd grade, the demographic groups most similar to Immigrants from Hungary are Immigrants from Bulgaria (97.9%, a difference of 0.0%), Immigrants from Kuwait (97.9%, a difference of 0.0%), Seminole (97.9%, a difference of 0.0%), Cambodian (97.9%, a difference of 0.010%), and Spaniard (97.9%, a difference of 0.010%).
| Demographics | Rating | Rank | 3rd Grade |
| Immigrants | Saudi Arabia | 93.5 /100 | #125 | Exceptional 98.0% |
| Immigrants | Zimbabwe | 93.4 /100 | #126 | Exceptional 98.0% |
| Ute | 93.2 /100 | #127 | Exceptional 98.0% |
| Colville | 92.1 /100 | #128 | Exceptional 98.0% |
| Immigrants | Serbia | 91.9 /100 | #129 | Exceptional 98.0% |
| Immigrants | Europe | 91.2 /100 | #130 | Exceptional 98.0% |
| Immigrants | Bulgaria | 89.1 /100 | #131 | Excellent 97.9% |
| Immigrants | Hungary | 88.8 /100 | #132 | Excellent 97.9% |
| Immigrants | Kuwait | 88.7 /100 | #133 | Excellent 97.9% |
| Seminole | 88.7 /100 | #134 | Excellent 97.9% |
| Cambodians | 88.1 /100 | #135 | Excellent 97.9% |
| Spaniards | 87.9 /100 | #136 | Excellent 97.9% |
| Immigrants | Romania | 87.9 /100 | #137 | Excellent 97.9% |
| Israelis | 86.6 /100 | #138 | Excellent 97.9% |
| Blackfeet | 86.3 /100 | #139 | Excellent 97.9% |
Demographics Similar to Immigrants from Sudan by 3rd Grade
In terms of 3rd grade, the demographic groups most similar to Immigrants from Sudan are Subsaharan African (97.5%, a difference of 0.010%), Senegalese (97.5%, a difference of 0.010%), Immigrants from Syria (97.5%, a difference of 0.020%), Bahamian (97.5%, a difference of 0.020%), and Tongan (97.5%, a difference of 0.020%).
| Demographics | Rating | Rank | 3rd Grade |
| Immigrants | Morocco | 5.0 /100 | #220 | Tragic 97.5% |
| Uruguayans | 5.0 /100 | #221 | Tragic 97.5% |
| Sierra Leoneans | 4.6 /100 | #222 | Tragic 97.5% |
| Immigrants | Syria | 4.4 /100 | #223 | Tragic 97.5% |
| Bahamians | 4.4 /100 | #224 | Tragic 97.5% |
| Tongans | 4.3 /100 | #225 | Tragic 97.5% |
| Sudanese | 4.1 /100 | #226 | Tragic 97.5% |
| Immigrants | Sudan | 3.4 /100 | #227 | Tragic 97.5% |
| Sub-Saharan Africans | 3.2 /100 | #228 | Tragic 97.5% |
| Senegalese | 3.0 /100 | #229 | Tragic 97.5% |
| Immigrants | Pakistan | 2.7 /100 | #230 | Tragic 97.5% |
| Immigrants | Costa Rica | 2.7 /100 | #231 | Tragic 97.5% |
| Immigrants | Western Asia | 2.6 /100 | #232 | Tragic 97.5% |
| Immigrants | Malaysia | 2.4 /100 | #233 | Tragic 97.5% |
| Immigrants | Eastern Asia | 1.9 /100 | #234 | Tragic 97.4% |