Immigrants from Latvia vs Slovene 7th Grade
COMPARE
Immigrants from Latvia
Slovene
7th Grade
7th Grade Comparison
Immigrants from Latvia
Slovenes
96.6%
7TH GRADE
97.4/ 100
METRIC RATING
111th/ 347
METRIC RANK
97.6%
7TH GRADE
100.0/ 100
METRIC RATING
10th/ 347
METRIC RANK
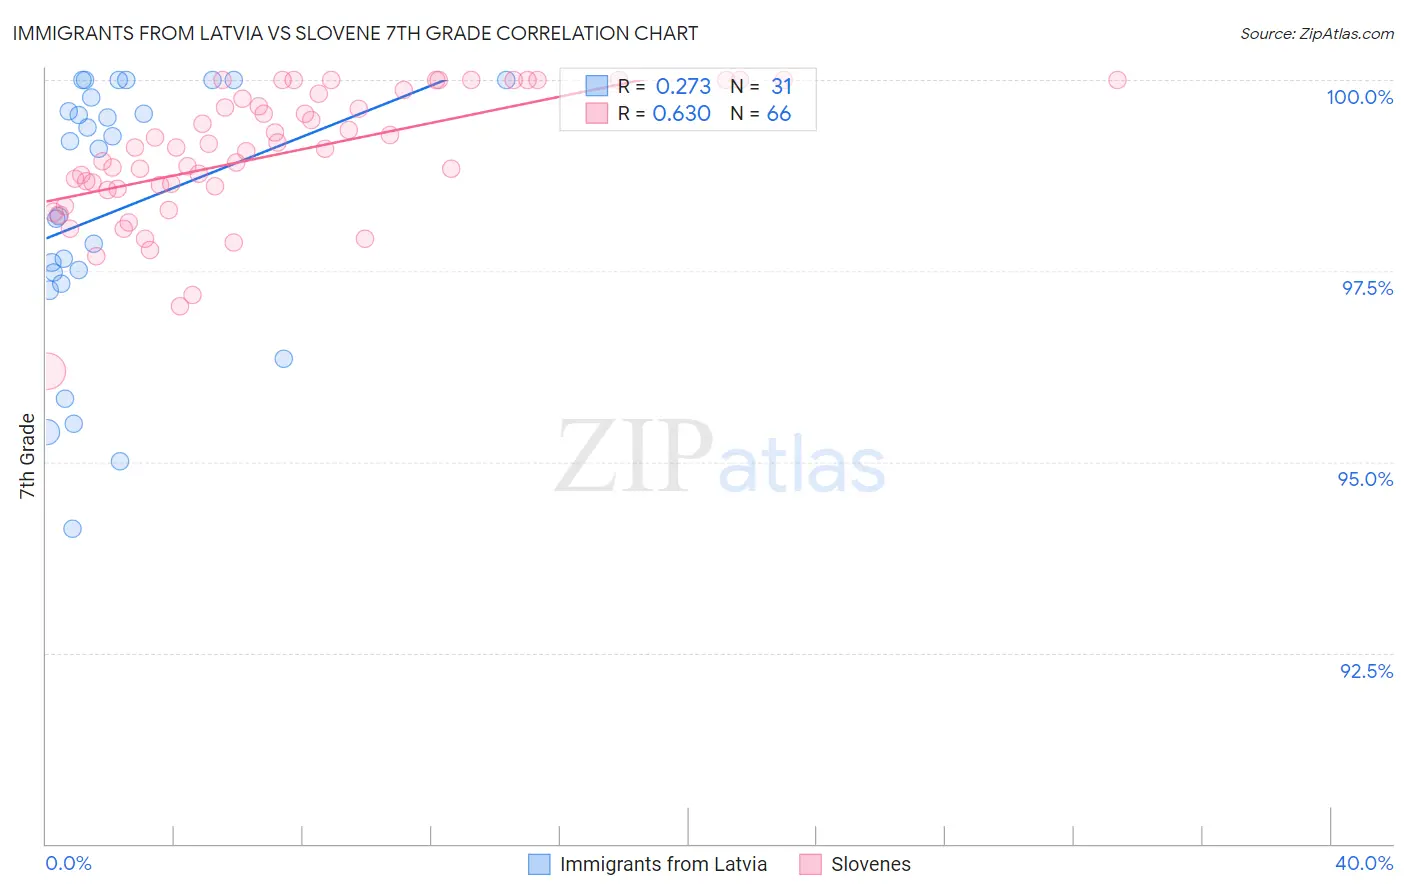
Immigrants from Latvia vs Slovene 7th Grade Correlation Chart
The statistical analysis conducted on geographies consisting of 113,735,345 people shows a weak positive correlation between the proportion of Immigrants from Latvia and percentage of population with at least 7th grade education in the United States with a correlation coefficient (R) of 0.273 and weighted average of 96.6%. Similarly, the statistical analysis conducted on geographies consisting of 261,353,374 people shows a significant positive correlation between the proportion of Slovenes and percentage of population with at least 7th grade education in the United States with a correlation coefficient (R) of 0.630 and weighted average of 97.6%, a difference of 1.1%.
7th Grade Correlation Summary
| Measurement | Immigrants from Latvia | Slovene |
| Minimum | 94.1% | 96.2% |
| Maximum | 100.0% | 100.0% |
| Range | 5.9% | 3.8% |
| Mean | 98.3% | 99.0% |
| Median | 99.1% | 99.1% |
| Interquartile 25% (IQ1) | 97.3% | 98.6% |
| Interquartile 75% (IQ3) | 99.8% | 99.8% |
| Interquartile Range (IQR) | 2.4% | 1.2% |
| Standard Deviation (Sample) | 1.7% | 0.85% |
| Standard Deviation (Population) | 1.7% | 0.85% |
Similar Demographics by 7th Grade
Demographics Similar to Immigrants from Latvia by 7th Grade
In terms of 7th grade, the demographic groups most similar to Immigrants from Latvia are Okinawan (96.6%, a difference of 0.0%), Bhutanese (96.6%, a difference of 0.020%), Nonimmigrants (96.5%, a difference of 0.020%), Lumbee (96.6%, a difference of 0.030%), and Immigrants from Saudi Arabia (96.6%, a difference of 0.030%).
| Demographics | Rating | Rank | 7th Grade |
| Shoshone | 98.1 /100 | #104 | Exceptional 96.6% |
| South Africans | 98.0 /100 | #105 | Exceptional 96.6% |
| Iroquois | 97.9 /100 | #106 | Exceptional 96.6% |
| Lumbee | 97.8 /100 | #107 | Exceptional 96.6% |
| Immigrants | Saudi Arabia | 97.8 /100 | #108 | Exceptional 96.6% |
| Bhutanese | 97.7 /100 | #109 | Exceptional 96.6% |
| Okinawans | 97.4 /100 | #110 | Exceptional 96.6% |
| Immigrants | Latvia | 97.4 /100 | #111 | Exceptional 96.6% |
| Immigrants | Nonimmigrants | 97.0 /100 | #112 | Exceptional 96.5% |
| Pueblo | 96.8 /100 | #113 | Exceptional 96.5% |
| Immigrants | Zimbabwe | 96.6 /100 | #114 | Exceptional 96.5% |
| Choctaw | 96.6 /100 | #115 | Exceptional 96.5% |
| Syrians | 96.6 /100 | #116 | Exceptional 96.5% |
| Immigrants | Moldova | 95.7 /100 | #117 | Exceptional 96.5% |
| Immigrants | Japan | 95.5 /100 | #118 | Exceptional 96.5% |
Demographics Similar to Slovenes by 7th Grade
In terms of 7th grade, the demographic groups most similar to Slovenes are Alaskan Athabascan (97.6%, a difference of 0.010%), Polish (97.6%, a difference of 0.020%), Swedish (97.6%, a difference of 0.050%), Pennsylvania German (97.6%, a difference of 0.060%), and English (97.6%, a difference of 0.070%).
| Demographics | Rating | Rank | 7th Grade |
| Carpatho Rusyns | 100.0 /100 | #3 | Exceptional 98.3% |
| Ottawa | 100.0 /100 | #4 | Exceptional 98.1% |
| Dutch | 100.0 /100 | #5 | Exceptional 97.9% |
| Tsimshian | 100.0 /100 | #6 | Exceptional 97.8% |
| Norwegians | 100.0 /100 | #7 | Exceptional 97.8% |
| Slovaks | 100.0 /100 | #8 | Exceptional 97.8% |
| Germans | 100.0 /100 | #9 | Exceptional 97.7% |
| Slovenes | 100.0 /100 | #10 | Exceptional 97.6% |
| Alaskan Athabascans | 100.0 /100 | #11 | Exceptional 97.6% |
| Poles | 100.0 /100 | #12 | Exceptional 97.6% |
| Swedes | 100.0 /100 | #13 | Exceptional 97.6% |
| Pennsylvania Germans | 100.0 /100 | #14 | Exceptional 97.6% |
| English | 100.0 /100 | #15 | Exceptional 97.6% |
| Irish | 100.0 /100 | #16 | Exceptional 97.5% |
| Scottish | 100.0 /100 | #17 | Exceptional 97.5% |