Immigrants from Latvia vs Slovene High School Diploma
COMPARE
Immigrants from Latvia
Slovene
High School Diploma
High School Diploma Comparison
Immigrants from Latvia
Slovenes
90.9%
HIGH SCHOOL DIPLOMA
99.5/ 100
METRIC RATING
70th/ 347
METRIC RANK
92.0%
HIGH SCHOOL DIPLOMA
100.0/ 100
METRIC RATING
5th/ 347
METRIC RANK
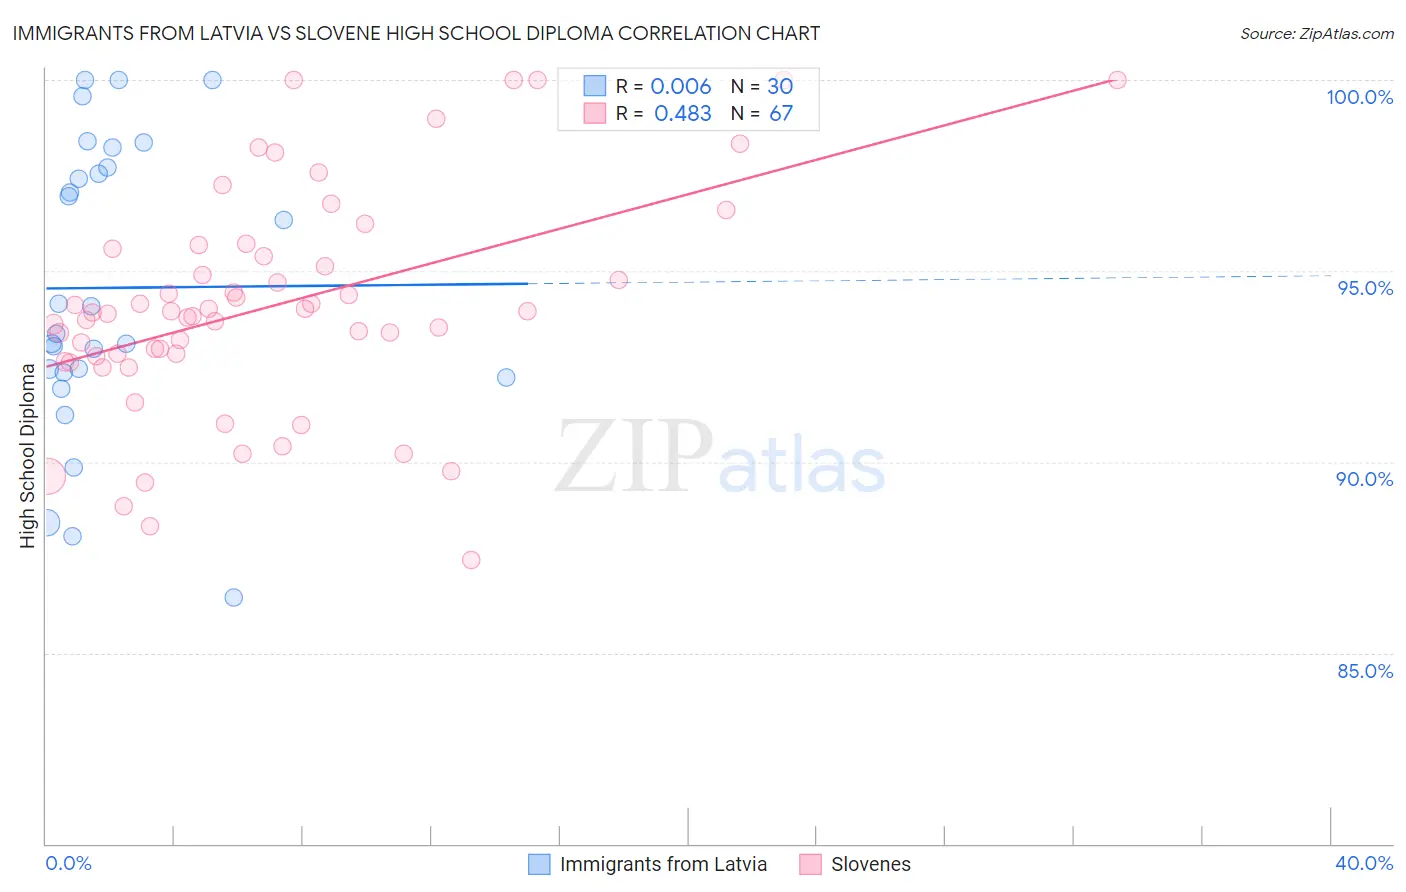
Immigrants from Latvia vs Slovene High School Diploma Correlation Chart
The statistical analysis conducted on geographies consisting of 113,734,781 people shows no correlation between the proportion of Immigrants from Latvia and percentage of population with at least high school diploma education in the United States with a correlation coefficient (R) of 0.006 and weighted average of 90.9%. Similarly, the statistical analysis conducted on geographies consisting of 261,353,550 people shows a moderate positive correlation between the proportion of Slovenes and percentage of population with at least high school diploma education in the United States with a correlation coefficient (R) of 0.483 and weighted average of 92.0%, a difference of 1.3%.
High School Diploma Correlation Summary
| Measurement | Immigrants from Latvia | Slovene |
| Minimum | 86.4% | 87.4% |
| Maximum | 100.0% | 100.0% |
| Range | 13.6% | 12.6% |
| Mean | 94.6% | 94.1% |
| Median | 93.7% | 93.9% |
| Interquartile 25% (IQ1) | 92.4% | 92.8% |
| Interquartile 75% (IQ3) | 97.7% | 95.6% |
| Interquartile Range (IQR) | 5.3% | 2.8% |
| Standard Deviation (Sample) | 3.8% | 2.9% |
| Standard Deviation (Population) | 3.7% | 2.9% |
Similar Demographics by High School Diploma
Demographics Similar to Immigrants from Latvia by High School Diploma
In terms of high school diploma, the demographic groups most similar to Immigrants from Latvia are French Canadian (90.9%, a difference of 0.0%), Alaskan Athabascan (90.9%, a difference of 0.0%), Soviet Union (90.9%, a difference of 0.010%), Immigrants from South Central Asia (90.9%, a difference of 0.030%), and Czechoslovakian (90.9%, a difference of 0.040%).
| Demographics | Rating | Rank | High School Diploma |
| Immigrants | Netherlands | 99.6 /100 | #63 | Exceptional 91.0% |
| Ukrainians | 99.6 /100 | #64 | Exceptional 91.0% |
| Immigrants | South Africa | 99.6 /100 | #65 | Exceptional 91.0% |
| French | 99.5 /100 | #66 | Exceptional 91.0% |
| Immigrants | Iran | 99.5 /100 | #67 | Exceptional 90.9% |
| Czechoslovakians | 99.5 /100 | #68 | Exceptional 90.9% |
| French Canadians | 99.5 /100 | #69 | Exceptional 90.9% |
| Immigrants | Latvia | 99.5 /100 | #70 | Exceptional 90.9% |
| Alaskan Athabascans | 99.4 /100 | #71 | Exceptional 90.9% |
| Soviet Union | 99.4 /100 | #72 | Exceptional 90.9% |
| Immigrants | South Central Asia | 99.4 /100 | #73 | Exceptional 90.9% |
| Immigrants | Czechoslovakia | 99.4 /100 | #74 | Exceptional 90.9% |
| Cambodians | 99.4 /100 | #75 | Exceptional 90.8% |
| Hungarians | 99.3 /100 | #76 | Exceptional 90.8% |
| Native Hawaiians | 99.3 /100 | #77 | Exceptional 90.8% |
Demographics Similar to Slovenes by High School Diploma
In terms of high school diploma, the demographic groups most similar to Slovenes are Lithuanian (92.0%, a difference of 0.0%), Slovak (92.0%, a difference of 0.020%), Immigrants from India (92.0%, a difference of 0.020%), Chinese (92.0%, a difference of 0.040%), and Latvian (92.0%, a difference of 0.050%).
| Demographics | Rating | Rank | High School Diploma |
| Norwegians | 100.0 /100 | #1 | Exceptional 92.5% |
| Swedes | 100.0 /100 | #2 | Exceptional 92.2% |
| Carpatho Rusyns | 100.0 /100 | #3 | Exceptional 92.1% |
| Lithuanians | 100.0 /100 | #4 | Exceptional 92.0% |
| Slovenes | 100.0 /100 | #5 | Exceptional 92.0% |
| Slovaks | 100.0 /100 | #6 | Exceptional 92.0% |
| Immigrants | India | 100.0 /100 | #7 | Exceptional 92.0% |
| Chinese | 100.0 /100 | #8 | Exceptional 92.0% |
| Latvians | 100.0 /100 | #9 | Exceptional 92.0% |
| Croatians | 100.0 /100 | #10 | Exceptional 92.0% |
| Eastern Europeans | 100.0 /100 | #11 | Exceptional 91.9% |
| Poles | 100.0 /100 | #12 | Exceptional 91.9% |
| Danes | 100.0 /100 | #13 | Exceptional 91.8% |
| Bulgarians | 100.0 /100 | #14 | Exceptional 91.8% |
| Luxembourgers | 100.0 /100 | #15 | Exceptional 91.7% |