Immigrants from Latvia vs Slovene Householder Income Under 25 years
COMPARE
Immigrants from Latvia
Slovene
Householder Income Under 25 years
Householder Income Under 25 years Comparison
Immigrants from Latvia
Slovenes
$51,737
HOUSEHOLDER INCOME UNDER 25 YEARS
24.8/ 100
METRIC RATING
185th/ 347
METRIC RANK
$50,886
HOUSEHOLDER INCOME UNDER 25 YEARS
4.0/ 100
METRIC RATING
232nd/ 347
METRIC RANK
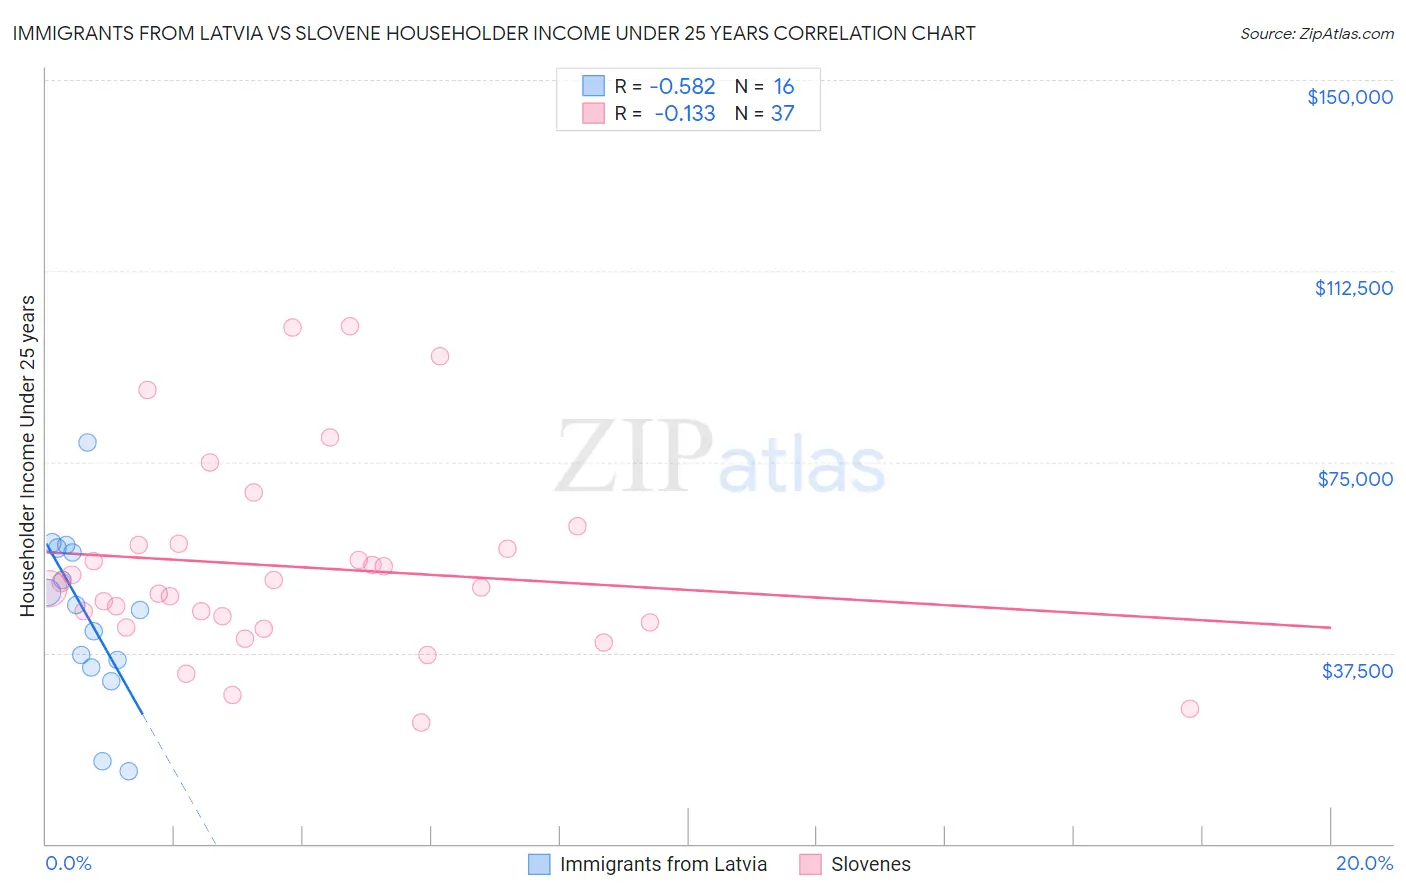
Immigrants from Latvia vs Slovene Householder Income Under 25 years Correlation Chart
The statistical analysis conducted on geographies consisting of 102,864,792 people shows a substantial negative correlation between the proportion of Immigrants from Latvia and household income with householder under the age of 25 in the United States with a correlation coefficient (R) of -0.582 and weighted average of $51,737. Similarly, the statistical analysis conducted on geographies consisting of 227,902,139 people shows a poor negative correlation between the proportion of Slovenes and household income with householder under the age of 25 in the United States with a correlation coefficient (R) of -0.133 and weighted average of $50,886, a difference of 1.7%.
Householder Income Under 25 years Correlation Summary
| Measurement | Immigrants from Latvia | Slovene |
| Minimum | $14,236 | $23,750 |
| Maximum | $78,750 | $101,719 |
| Range | $64,514 | $77,969 |
| Mean | $44,878 | $54,363 |
| Median | $46,410 | $50,342 |
| Interquartile 25% (IQ1) | $35,358 | $42,924 |
| Interquartile 75% (IQ3) | $57,575 | $58,799 |
| Interquartile Range (IQR) | $22,216 | $15,875 |
| Standard Deviation (Sample) | $16,557 | $19,097 |
| Standard Deviation (Population) | $16,032 | $18,837 |
Similar Demographics by Householder Income Under 25 years
Demographics Similar to Immigrants from Latvia by Householder Income Under 25 years
In terms of householder income under 25 years, the demographic groups most similar to Immigrants from Latvia are Paiute ($51,743, a difference of 0.010%), Alaskan Athabascan ($51,713, a difference of 0.050%), Immigrants from South Africa ($51,705, a difference of 0.060%), Mexican American Indian ($51,783, a difference of 0.090%), and European ($51,796, a difference of 0.11%).
| Demographics | Rating | Rank | Householder Income Under 25 years |
| Finns | 29.2 /100 | #178 | Fair $51,827 |
| Basques | 28.7 /100 | #179 | Fair $51,818 |
| Immigrants | England | 28.7 /100 | #180 | Fair $51,817 |
| Europeans | 27.6 /100 | #181 | Fair $51,796 |
| Jordanians | 27.6 /100 | #182 | Fair $51,796 |
| Mexican American Indians | 27.0 /100 | #183 | Fair $51,783 |
| Paiute | 25.1 /100 | #184 | Fair $51,743 |
| Immigrants | Latvia | 24.8 /100 | #185 | Fair $51,737 |
| Alaskan Athabascans | 23.8 /100 | #186 | Fair $51,713 |
| Immigrants | South Africa | 23.4 /100 | #187 | Fair $51,705 |
| Northern Europeans | 22.2 /100 | #188 | Fair $51,678 |
| Croatians | 21.6 /100 | #189 | Fair $51,662 |
| Malaysians | 19.7 /100 | #190 | Poor $51,615 |
| Panamanians | 19.5 /100 | #191 | Poor $51,611 |
| West Indians | 18.5 /100 | #192 | Poor $51,583 |
Demographics Similar to Slovenes by Householder Income Under 25 years
In terms of householder income under 25 years, the demographic groups most similar to Slovenes are Ugandan ($50,923, a difference of 0.070%), Pennsylvania German ($50,852, a difference of 0.070%), Jamaican ($50,929, a difference of 0.080%), Yuman ($50,933, a difference of 0.090%), and Kenyan ($50,815, a difference of 0.14%).
| Demographics | Rating | Rank | Householder Income Under 25 years |
| Immigrants | Jamaica | 5.6 /100 | #225 | Tragic $51,038 |
| Yugoslavians | 5.5 /100 | #226 | Tragic $51,028 |
| Immigrants | Central America | 5.4 /100 | #227 | Tragic $51,022 |
| Immigrants | Norway | 5.0 /100 | #228 | Tragic $50,984 |
| Yuman | 4.4 /100 | #229 | Tragic $50,933 |
| Jamaicans | 4.4 /100 | #230 | Tragic $50,929 |
| Ugandans | 4.3 /100 | #231 | Tragic $50,923 |
| Slovenes | 4.0 /100 | #232 | Tragic $50,886 |
| Pennsylvania Germans | 3.7 /100 | #233 | Tragic $50,852 |
| Kenyans | 3.3 /100 | #234 | Tragic $50,815 |
| Spanish | 3.3 /100 | #235 | Tragic $50,813 |
| English | 3.3 /100 | #236 | Tragic $50,805 |
| Germans | 3.3 /100 | #237 | Tragic $50,804 |
| Iraqis | 3.2 /100 | #238 | Tragic $50,802 |
| Immigrants | Caribbean | 2.9 /100 | #239 | Tragic $50,757 |