Immigrants from Somalia vs Slovene 7th Grade
COMPARE
Immigrants from Somalia
Slovene
7th Grade
7th Grade Comparison
Immigrants from Somalia
Slovenes
95.2%
7TH GRADE
0.5/ 100
METRIC RATING
262nd/ 347
METRIC RANK
97.6%
7TH GRADE
100.0/ 100
METRIC RATING
10th/ 347
METRIC RANK
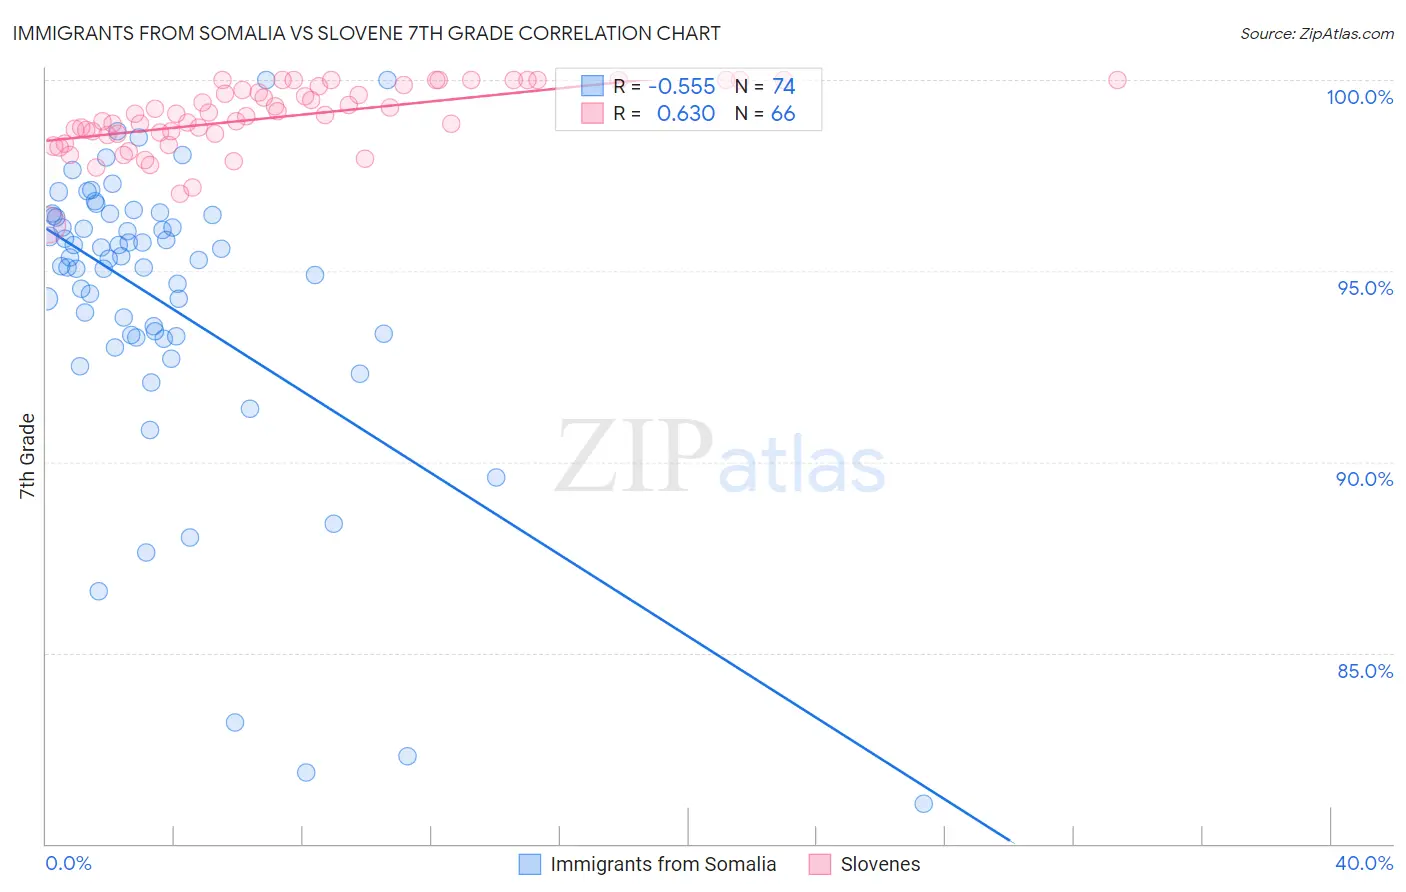
Immigrants from Somalia vs Slovene 7th Grade Correlation Chart
The statistical analysis conducted on geographies consisting of 92,098,504 people shows a substantial negative correlation between the proportion of Immigrants from Somalia and percentage of population with at least 7th grade education in the United States with a correlation coefficient (R) of -0.555 and weighted average of 95.2%. Similarly, the statistical analysis conducted on geographies consisting of 261,353,374 people shows a significant positive correlation between the proportion of Slovenes and percentage of population with at least 7th grade education in the United States with a correlation coefficient (R) of 0.630 and weighted average of 97.6%, a difference of 2.5%.
7th Grade Correlation Summary
| Measurement | Immigrants from Somalia | Slovene |
| Minimum | 81.1% | 96.2% |
| Maximum | 100.0% | 100.0% |
| Range | 18.9% | 3.8% |
| Mean | 94.2% | 99.0% |
| Median | 95.3% | 99.1% |
| Interquartile 25% (IQ1) | 93.3% | 98.6% |
| Interquartile 75% (IQ3) | 96.4% | 99.8% |
| Interquartile Range (IQR) | 3.2% | 1.2% |
| Standard Deviation (Sample) | 3.9% | 0.85% |
| Standard Deviation (Population) | 3.9% | 0.85% |
Similar Demographics by 7th Grade
Demographics Similar to Immigrants from Somalia by 7th Grade
In terms of 7th grade, the demographic groups most similar to Immigrants from Somalia are South American (95.2%, a difference of 0.0%), West Indian (95.2%, a difference of 0.0%), Afghan (95.3%, a difference of 0.010%), Immigrants from Nigeria (95.2%, a difference of 0.010%), and Immigrants from Costa Rica (95.3%, a difference of 0.040%).
| Demographics | Rating | Rank | 7th Grade |
| Koreans | 0.8 /100 | #255 | Tragic 95.3% |
| Immigrants | China | 0.7 /100 | #256 | Tragic 95.3% |
| Immigrants | Congo | 0.7 /100 | #257 | Tragic 95.3% |
| Ghanaians | 0.7 /100 | #258 | Tragic 95.3% |
| Immigrants | Costa Rica | 0.6 /100 | #259 | Tragic 95.3% |
| Afghans | 0.5 /100 | #260 | Tragic 95.3% |
| South Americans | 0.5 /100 | #261 | Tragic 95.2% |
| Immigrants | Somalia | 0.5 /100 | #262 | Tragic 95.2% |
| West Indians | 0.5 /100 | #263 | Tragic 95.2% |
| Immigrants | Nigeria | 0.4 /100 | #264 | Tragic 95.2% |
| Immigrants | Uruguay | 0.3 /100 | #265 | Tragic 95.2% |
| Immigrants | Ghana | 0.3 /100 | #266 | Tragic 95.2% |
| Yuman | 0.3 /100 | #267 | Tragic 95.2% |
| Immigrants | Hong Kong | 0.3 /100 | #268 | Tragic 95.2% |
| Trinidadians and Tobagonians | 0.3 /100 | #269 | Tragic 95.2% |
Demographics Similar to Slovenes by 7th Grade
In terms of 7th grade, the demographic groups most similar to Slovenes are Alaskan Athabascan (97.6%, a difference of 0.010%), Polish (97.6%, a difference of 0.020%), Swedish (97.6%, a difference of 0.050%), Pennsylvania German (97.6%, a difference of 0.060%), and English (97.6%, a difference of 0.070%).
| Demographics | Rating | Rank | 7th Grade |
| Carpatho Rusyns | 100.0 /100 | #3 | Exceptional 98.3% |
| Ottawa | 100.0 /100 | #4 | Exceptional 98.1% |
| Dutch | 100.0 /100 | #5 | Exceptional 97.9% |
| Tsimshian | 100.0 /100 | #6 | Exceptional 97.8% |
| Norwegians | 100.0 /100 | #7 | Exceptional 97.8% |
| Slovaks | 100.0 /100 | #8 | Exceptional 97.8% |
| Germans | 100.0 /100 | #9 | Exceptional 97.7% |
| Slovenes | 100.0 /100 | #10 | Exceptional 97.6% |
| Alaskan Athabascans | 100.0 /100 | #11 | Exceptional 97.6% |
| Poles | 100.0 /100 | #12 | Exceptional 97.6% |
| Swedes | 100.0 /100 | #13 | Exceptional 97.6% |
| Pennsylvania Germans | 100.0 /100 | #14 | Exceptional 97.6% |
| English | 100.0 /100 | #15 | Exceptional 97.6% |
| Irish | 100.0 /100 | #16 | Exceptional 97.5% |
| Scottish | 100.0 /100 | #17 | Exceptional 97.5% |