Immigrants from Barbados vs Slovene 7th Grade
COMPARE
Immigrants from Barbados
Slovene
7th Grade
7th Grade Comparison
Immigrants from Barbados
Slovenes
95.0%
7TH GRADE
0.1/ 100
METRIC RATING
283rd/ 347
METRIC RANK
97.6%
7TH GRADE
100.0/ 100
METRIC RATING
10th/ 347
METRIC RANK
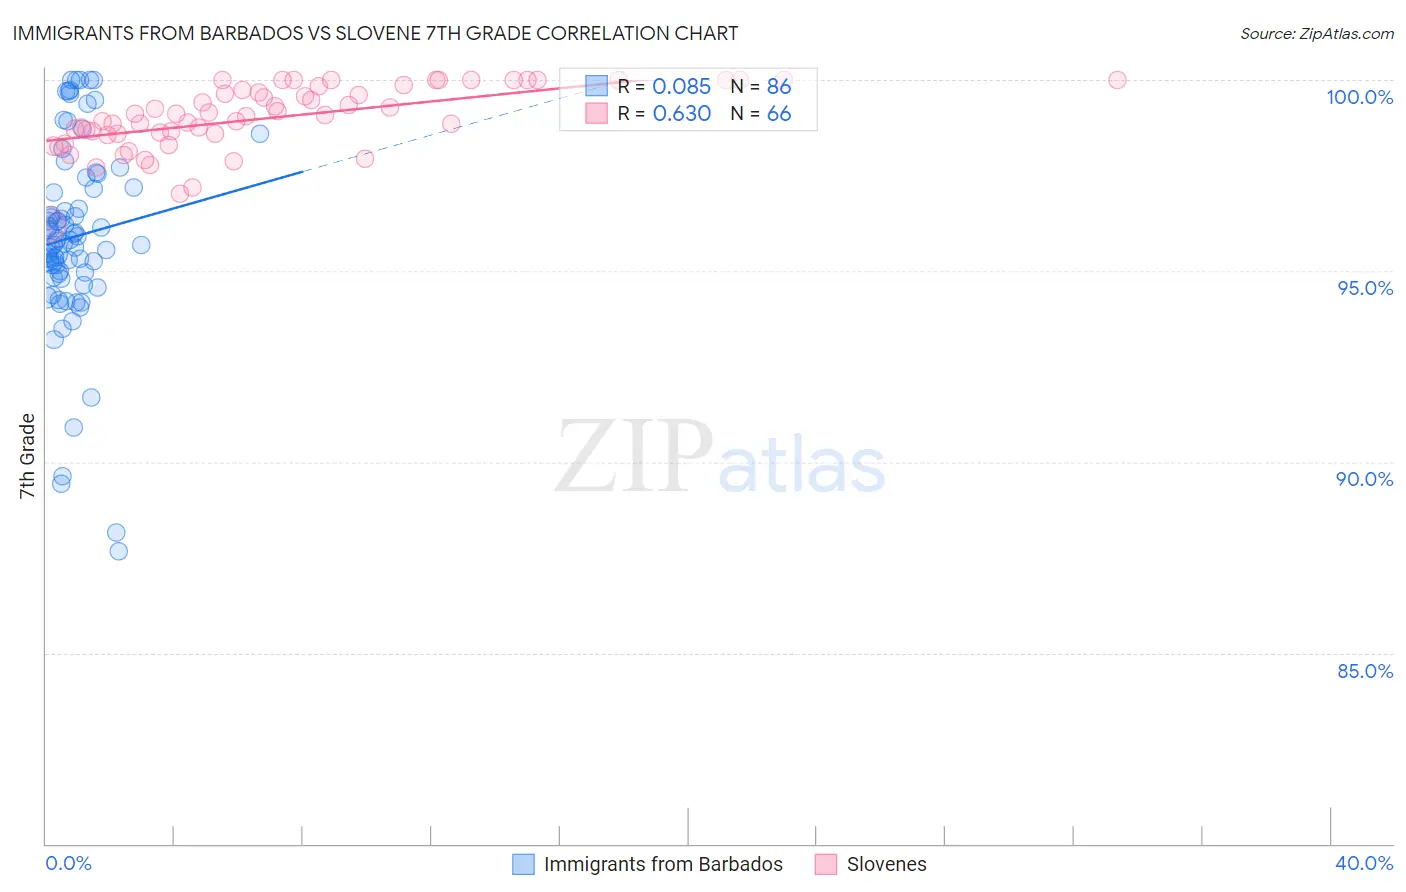
Immigrants from Barbados vs Slovene 7th Grade Correlation Chart
The statistical analysis conducted on geographies consisting of 112,787,165 people shows a slight positive correlation between the proportion of Immigrants from Barbados and percentage of population with at least 7th grade education in the United States with a correlation coefficient (R) of 0.085 and weighted average of 95.0%. Similarly, the statistical analysis conducted on geographies consisting of 261,353,374 people shows a significant positive correlation between the proportion of Slovenes and percentage of population with at least 7th grade education in the United States with a correlation coefficient (R) of 0.630 and weighted average of 97.6%, a difference of 2.8%.
7th Grade Correlation Summary
| Measurement | Immigrants from Barbados | Slovene |
| Minimum | 87.6% | 96.2% |
| Maximum | 100.0% | 100.0% |
| Range | 12.4% | 3.8% |
| Mean | 95.9% | 99.0% |
| Median | 95.8% | 99.1% |
| Interquartile 25% (IQ1) | 94.9% | 98.6% |
| Interquartile 75% (IQ3) | 97.2% | 99.8% |
| Interquartile Range (IQR) | 2.3% | 1.2% |
| Standard Deviation (Sample) | 2.5% | 0.85% |
| Standard Deviation (Population) | 2.5% | 0.85% |
Similar Demographics by 7th Grade
Demographics Similar to Immigrants from Barbados by 7th Grade
In terms of 7th grade, the demographic groups most similar to Immigrants from Barbados are Armenian (95.0%, a difference of 0.0%), Immigrants from Eritrea (94.9%, a difference of 0.010%), Immigrants from Bolivia (95.0%, a difference of 0.060%), Immigrants from St. Vincent and the Grenadines (95.0%, a difference of 0.070%), and Tohono O'odham (95.0%, a difference of 0.070%).
| Demographics | Rating | Rank | 7th Grade |
| Immigrants | Thailand | 0.2 /100 | #276 | Tragic 95.1% |
| Immigrants | Afghanistan | 0.2 /100 | #277 | Tragic 95.1% |
| Immigrants | Trinidad and Tobago | 0.1 /100 | #278 | Tragic 95.1% |
| Barbadians | 0.1 /100 | #279 | Tragic 95.1% |
| Immigrants | St. Vincent and the Grenadines | 0.1 /100 | #280 | Tragic 95.0% |
| Tohono O'odham | 0.1 /100 | #281 | Tragic 95.0% |
| Immigrants | Bolivia | 0.1 /100 | #282 | Tragic 95.0% |
| Immigrants | Barbados | 0.1 /100 | #283 | Tragic 95.0% |
| Armenians | 0.1 /100 | #284 | Tragic 95.0% |
| Immigrants | Eritrea | 0.1 /100 | #285 | Tragic 94.9% |
| Immigrants | Philippines | 0.0 /100 | #286 | Tragic 94.9% |
| Immigrants | Peru | 0.0 /100 | #287 | Tragic 94.9% |
| British West Indians | 0.0 /100 | #288 | Tragic 94.8% |
| Taiwanese | 0.0 /100 | #289 | Tragic 94.8% |
| Malaysians | 0.0 /100 | #290 | Tragic 94.8% |
Demographics Similar to Slovenes by 7th Grade
In terms of 7th grade, the demographic groups most similar to Slovenes are Alaskan Athabascan (97.6%, a difference of 0.010%), Polish (97.6%, a difference of 0.020%), Swedish (97.6%, a difference of 0.050%), Pennsylvania German (97.6%, a difference of 0.060%), and English (97.6%, a difference of 0.070%).
| Demographics | Rating | Rank | 7th Grade |
| Carpatho Rusyns | 100.0 /100 | #3 | Exceptional 98.3% |
| Ottawa | 100.0 /100 | #4 | Exceptional 98.1% |
| Dutch | 100.0 /100 | #5 | Exceptional 97.9% |
| Tsimshian | 100.0 /100 | #6 | Exceptional 97.8% |
| Norwegians | 100.0 /100 | #7 | Exceptional 97.8% |
| Slovaks | 100.0 /100 | #8 | Exceptional 97.8% |
| Germans | 100.0 /100 | #9 | Exceptional 97.7% |
| Slovenes | 100.0 /100 | #10 | Exceptional 97.6% |
| Alaskan Athabascans | 100.0 /100 | #11 | Exceptional 97.6% |
| Poles | 100.0 /100 | #12 | Exceptional 97.6% |
| Swedes | 100.0 /100 | #13 | Exceptional 97.6% |
| Pennsylvania Germans | 100.0 /100 | #14 | Exceptional 97.6% |
| English | 100.0 /100 | #15 | Exceptional 97.6% |
| Irish | 100.0 /100 | #16 | Exceptional 97.5% |
| Scottish | 100.0 /100 | #17 | Exceptional 97.5% |