Immigrants from Latvia vs Native Hawaiian 7th Grade
COMPARE
Immigrants from Latvia
Native Hawaiian
7th Grade
7th Grade Comparison
Immigrants from Latvia
Native Hawaiians
96.6%
7TH GRADE
97.4/ 100
METRIC RATING
111th/ 347
METRIC RANK
96.9%
7TH GRADE
99.7/ 100
METRIC RATING
67th/ 347
METRIC RANK
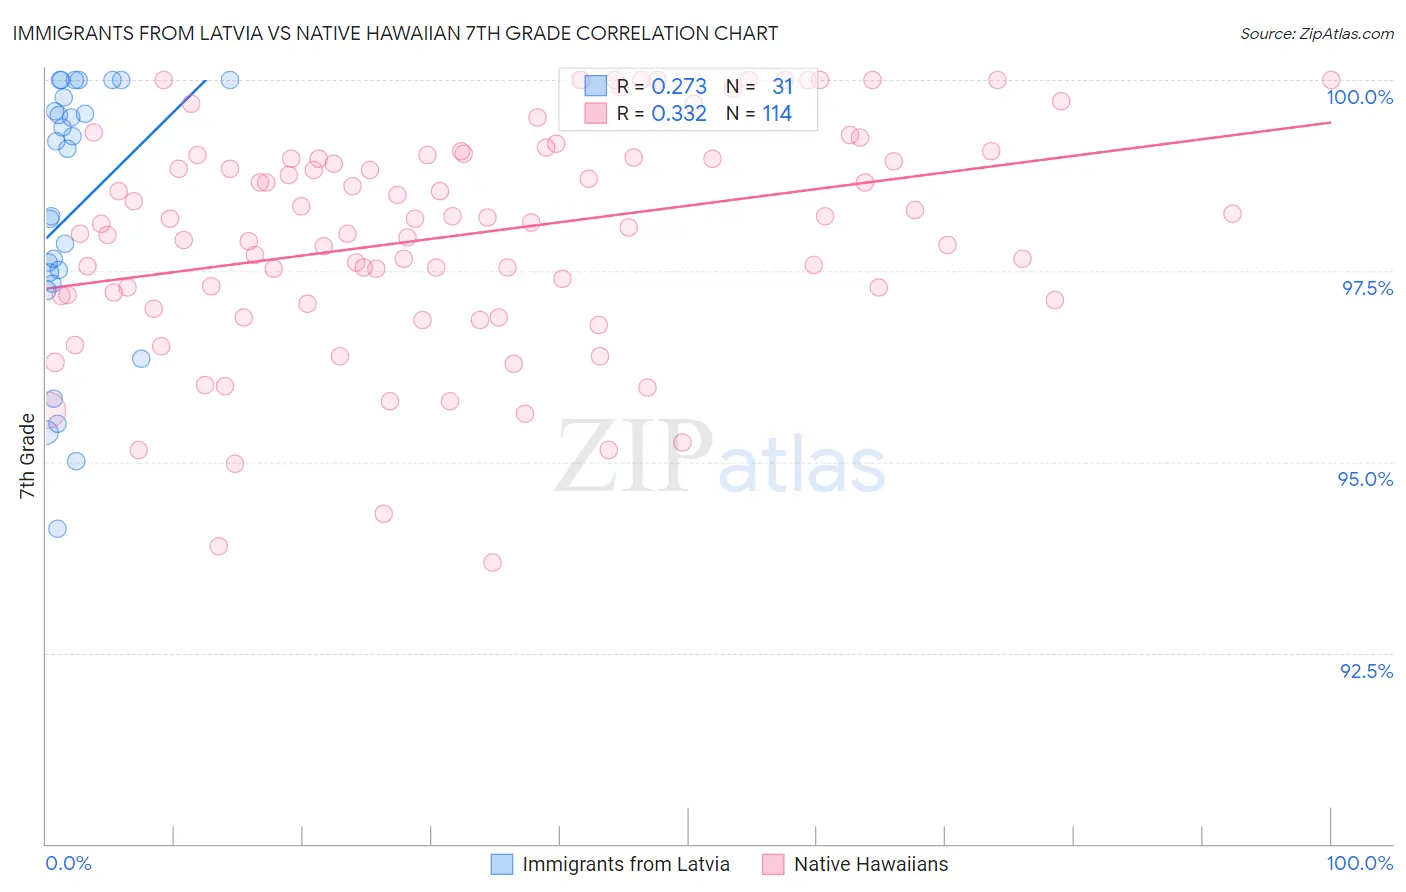
Immigrants from Latvia vs Native Hawaiian 7th Grade Correlation Chart
The statistical analysis conducted on geographies consisting of 113,735,345 people shows a weak positive correlation between the proportion of Immigrants from Latvia and percentage of population with at least 7th grade education in the United States with a correlation coefficient (R) of 0.273 and weighted average of 96.6%. Similarly, the statistical analysis conducted on geographies consisting of 332,101,429 people shows a mild positive correlation between the proportion of Native Hawaiians and percentage of population with at least 7th grade education in the United States with a correlation coefficient (R) of 0.332 and weighted average of 96.9%, a difference of 0.33%.
7th Grade Correlation Summary
| Measurement | Immigrants from Latvia | Native Hawaiian |
| Minimum | 94.1% | 93.7% |
| Maximum | 100.0% | 100.0% |
| Range | 5.9% | 6.3% |
| Mean | 98.3% | 98.0% |
| Median | 99.1% | 98.2% |
| Interquartile 25% (IQ1) | 97.3% | 97.2% |
| Interquartile 75% (IQ3) | 99.8% | 99.0% |
| Interquartile Range (IQR) | 2.4% | 1.8% |
| Standard Deviation (Sample) | 1.7% | 1.5% |
| Standard Deviation (Population) | 1.7% | 1.5% |
Similar Demographics by 7th Grade
Demographics Similar to Immigrants from Latvia by 7th Grade
In terms of 7th grade, the demographic groups most similar to Immigrants from Latvia are Okinawan (96.6%, a difference of 0.0%), Bhutanese (96.6%, a difference of 0.020%), Nonimmigrants (96.5%, a difference of 0.020%), Lumbee (96.6%, a difference of 0.030%), and Immigrants from Saudi Arabia (96.6%, a difference of 0.030%).
| Demographics | Rating | Rank | 7th Grade |
| Shoshone | 98.1 /100 | #104 | Exceptional 96.6% |
| South Africans | 98.0 /100 | #105 | Exceptional 96.6% |
| Iroquois | 97.9 /100 | #106 | Exceptional 96.6% |
| Lumbee | 97.8 /100 | #107 | Exceptional 96.6% |
| Immigrants | Saudi Arabia | 97.8 /100 | #108 | Exceptional 96.6% |
| Bhutanese | 97.7 /100 | #109 | Exceptional 96.6% |
| Okinawans | 97.4 /100 | #110 | Exceptional 96.6% |
| Immigrants | Latvia | 97.4 /100 | #111 | Exceptional 96.6% |
| Immigrants | Nonimmigrants | 97.0 /100 | #112 | Exceptional 96.5% |
| Pueblo | 96.8 /100 | #113 | Exceptional 96.5% |
| Immigrants | Zimbabwe | 96.6 /100 | #114 | Exceptional 96.5% |
| Choctaw | 96.6 /100 | #115 | Exceptional 96.5% |
| Syrians | 96.6 /100 | #116 | Exceptional 96.5% |
| Immigrants | Moldova | 95.7 /100 | #117 | Exceptional 96.5% |
| Immigrants | Japan | 95.5 /100 | #118 | Exceptional 96.5% |
Demographics Similar to Native Hawaiians by 7th Grade
In terms of 7th grade, the demographic groups most similar to Native Hawaiians are Ukrainian (96.9%, a difference of 0.0%), Immigrants from Austria (96.9%, a difference of 0.020%), Canadian (96.9%, a difference of 0.020%), Immigrants from India (96.9%, a difference of 0.020%), and Immigrants from Northern Europe (96.9%, a difference of 0.030%).
| Demographics | Rating | Rank | 7th Grade |
| Immigrants | Canada | 99.8 /100 | #60 | Exceptional 96.9% |
| Creek | 99.8 /100 | #61 | Exceptional 96.9% |
| Immigrants | North America | 99.8 /100 | #62 | Exceptional 96.9% |
| Immigrants | Northern Europe | 99.7 /100 | #63 | Exceptional 96.9% |
| Immigrants | Austria | 99.7 /100 | #64 | Exceptional 96.9% |
| Canadians | 99.7 /100 | #65 | Exceptional 96.9% |
| Ukrainians | 99.7 /100 | #66 | Exceptional 96.9% |
| Native Hawaiians | 99.7 /100 | #67 | Exceptional 96.9% |
| Immigrants | India | 99.6 /100 | #68 | Exceptional 96.9% |
| Iranians | 99.6 /100 | #69 | Exceptional 96.8% |
| New Zealanders | 99.6 /100 | #70 | Exceptional 96.8% |
| Immigrants | Lithuania | 99.6 /100 | #71 | Exceptional 96.8% |
| Cajuns | 99.5 /100 | #72 | Exceptional 96.8% |
| Arapaho | 99.5 /100 | #73 | Exceptional 96.8% |
| Immigrants | England | 99.5 /100 | #74 | Exceptional 96.8% |