Immigrants from Latvia vs Salvadoran Bachelor's Degree
COMPARE
Immigrants from Latvia
Salvadoran
Bachelor's Degree
Bachelor's Degree Comparison
Immigrants from Latvia
Salvadorans
45.1%
BACHELOR'S DEGREE
100.0/ 100
METRIC RATING
39th/ 347
METRIC RANK
31.8%
BACHELOR'S DEGREE
0.1/ 100
METRIC RATING
276th/ 347
METRIC RANK
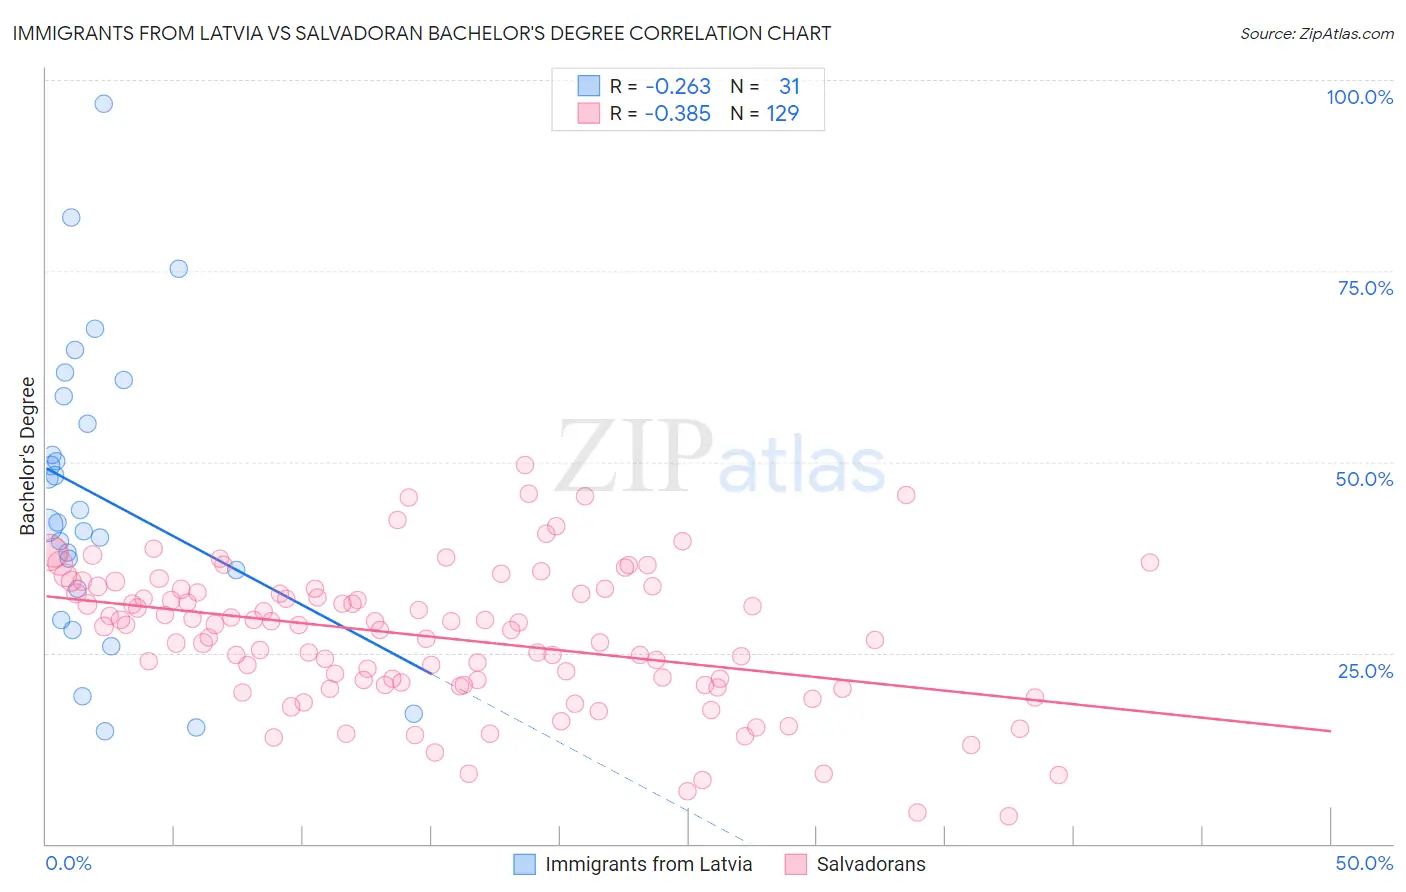
Immigrants from Latvia vs Salvadoran Bachelor's Degree Correlation Chart
The statistical analysis conducted on geographies consisting of 113,735,345 people shows a weak negative correlation between the proportion of Immigrants from Latvia and percentage of population with at least bachelor's degree education in the United States with a correlation coefficient (R) of -0.263 and weighted average of 45.1%. Similarly, the statistical analysis conducted on geographies consisting of 399,013,462 people shows a mild negative correlation between the proportion of Salvadorans and percentage of population with at least bachelor's degree education in the United States with a correlation coefficient (R) of -0.385 and weighted average of 31.8%, a difference of 42.0%.
Bachelor's Degree Correlation Summary
| Measurement | Immigrants from Latvia | Salvadoran |
| Minimum | 14.7% | 3.6% |
| Maximum | 96.9% | 49.6% |
| Range | 82.2% | 46.0% |
| Mean | 45.5% | 27.1% |
| Median | 42.0% | 28.7% |
| Interquartile 25% (IQ1) | 33.3% | 20.8% |
| Interquartile 75% (IQ3) | 58.6% | 33.3% |
| Interquartile Range (IQR) | 25.3% | 12.5% |
| Standard Deviation (Sample) | 19.4% | 9.2% |
| Standard Deviation (Population) | 19.1% | 9.2% |
Similar Demographics by Bachelor's Degree
Demographics Similar to Immigrants from Latvia by Bachelor's Degree
In terms of bachelor's degree, the demographic groups most similar to Immigrants from Latvia are Immigrants from Belarus (45.0%, a difference of 0.27%), Immigrants from Malaysia (45.0%, a difference of 0.31%), Bulgarian (45.3%, a difference of 0.33%), Russian (45.3%, a difference of 0.42%), and Mongolian (45.4%, a difference of 0.57%).
| Demographics | Rating | Rank | Bachelor's Degree |
| Immigrants | Turkey | 100.0 /100 | #32 | Exceptional 46.0% |
| Immigrants | Northern Europe | 100.0 /100 | #33 | Exceptional 45.6% |
| Immigrants | Denmark | 100.0 /100 | #34 | Exceptional 45.4% |
| Immigrants | Russia | 100.0 /100 | #35 | Exceptional 45.4% |
| Mongolians | 100.0 /100 | #36 | Exceptional 45.4% |
| Russians | 100.0 /100 | #37 | Exceptional 45.3% |
| Bulgarians | 100.0 /100 | #38 | Exceptional 45.3% |
| Immigrants | Latvia | 100.0 /100 | #39 | Exceptional 45.1% |
| Immigrants | Belarus | 100.0 /100 | #40 | Exceptional 45.0% |
| Immigrants | Malaysia | 100.0 /100 | #41 | Exceptional 45.0% |
| Immigrants | Saudi Arabia | 100.0 /100 | #42 | Exceptional 44.8% |
| Immigrants | South Africa | 99.9 /100 | #43 | Exceptional 44.8% |
| Immigrants | Lithuania | 99.9 /100 | #44 | Exceptional 44.6% |
| Immigrants | Kuwait | 99.9 /100 | #45 | Exceptional 44.6% |
| Immigrants | Bulgaria | 99.9 /100 | #46 | Exceptional 44.6% |
Demographics Similar to Salvadorans by Bachelor's Degree
In terms of bachelor's degree, the demographic groups most similar to Salvadorans are Samoan (31.8%, a difference of 0.040%), Dominican (31.8%, a difference of 0.15%), Potawatomi (31.9%, a difference of 0.17%), American (31.9%, a difference of 0.19%), and Marshallese (31.7%, a difference of 0.20%).
| Demographics | Rating | Rank | Bachelor's Degree |
| Immigrants | Belize | 0.2 /100 | #269 | Tragic 32.1% |
| Immigrants | Nicaragua | 0.2 /100 | #270 | Tragic 31.9% |
| Central Americans | 0.2 /100 | #271 | Tragic 31.9% |
| Comanche | 0.2 /100 | #272 | Tragic 31.9% |
| Americans | 0.2 /100 | #273 | Tragic 31.9% |
| Potawatomi | 0.2 /100 | #274 | Tragic 31.9% |
| Samoans | 0.1 /100 | #275 | Tragic 31.8% |
| Salvadorans | 0.1 /100 | #276 | Tragic 31.8% |
| Dominicans | 0.1 /100 | #277 | Tragic 31.8% |
| Marshallese | 0.1 /100 | #278 | Tragic 31.7% |
| Hawaiians | 0.1 /100 | #279 | Tragic 31.6% |
| Immigrants | Laos | 0.1 /100 | #280 | Tragic 31.6% |
| Blackfeet | 0.1 /100 | #281 | Tragic 31.5% |
| Immigrants | Caribbean | 0.1 /100 | #282 | Tragic 31.4% |
| Hondurans | 0.1 /100 | #283 | Tragic 31.3% |