Australian vs Immigrants from Sri Lanka 2nd Grade
COMPARE
Australian
Immigrants from Sri Lanka
2nd Grade
2nd Grade Comparison
Australians
Immigrants from Sri Lanka
98.4%
2ND GRADE
99.8/ 100
METRIC RATING
52nd/ 347
METRIC RANK
97.9%
2ND GRADE
48.7/ 100
METRIC RATING
176th/ 347
METRIC RANK
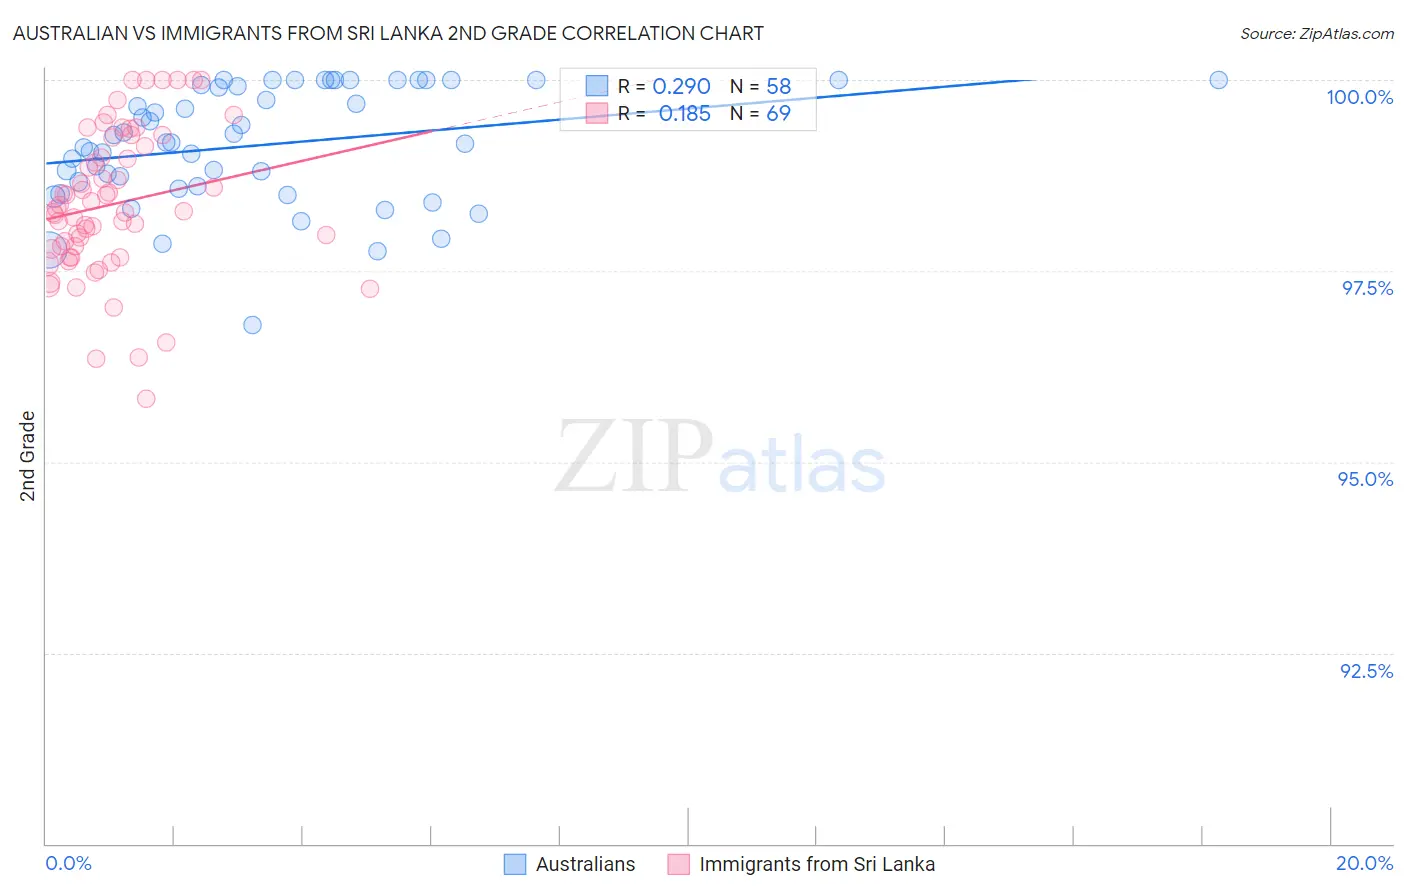
Australian vs Immigrants from Sri Lanka 2nd Grade Correlation Chart
The statistical analysis conducted on geographies consisting of 224,153,392 people shows a weak positive correlation between the proportion of Australians and percentage of population with at least 2nd grade education in the United States with a correlation coefficient (R) of 0.290 and weighted average of 98.4%. Similarly, the statistical analysis conducted on geographies consisting of 149,700,552 people shows a poor positive correlation between the proportion of Immigrants from Sri Lanka and percentage of population with at least 2nd grade education in the United States with a correlation coefficient (R) of 0.185 and weighted average of 97.9%, a difference of 0.51%.
2nd Grade Correlation Summary
| Measurement | Australian | Immigrants from Sri Lanka |
| Minimum | 96.8% | 95.8% |
| Maximum | 100.0% | 100.0% |
| Range | 3.2% | 4.2% |
| Mean | 99.2% | 98.4% |
| Median | 99.2% | 98.3% |
| Interquartile 25% (IQ1) | 98.6% | 97.7% |
| Interquartile 75% (IQ3) | 99.9% | 99.2% |
| Interquartile Range (IQR) | 1.3% | 1.5% |
| Standard Deviation (Sample) | 0.76% | 0.95% |
| Standard Deviation (Population) | 0.75% | 0.94% |
Similar Demographics by 2nd Grade
Demographics Similar to Australians by 2nd Grade
In terms of 2nd grade, the demographic groups most similar to Australians are Celtic (98.4%, a difference of 0.0%), White/Caucasian (98.4%, a difference of 0.0%), Estonian (98.4%, a difference of 0.0%), Pueblo (98.3%, a difference of 0.010%), and Kiowa (98.3%, a difference of 0.010%).
| Demographics | Rating | Rank | 2nd Grade |
| Hungarians | 99.9 /100 | #45 | Exceptional 98.4% |
| Lumbee | 99.9 /100 | #46 | Exceptional 98.4% |
| Ottawa | 99.9 /100 | #47 | Exceptional 98.4% |
| Czechoslovakians | 99.9 /100 | #48 | Exceptional 98.4% |
| Celtics | 99.8 /100 | #49 | Exceptional 98.4% |
| Whites/Caucasians | 99.8 /100 | #50 | Exceptional 98.4% |
| Estonians | 99.8 /100 | #51 | Exceptional 98.4% |
| Australians | 99.8 /100 | #52 | Exceptional 98.4% |
| Pueblo | 99.8 /100 | #53 | Exceptional 98.3% |
| Kiowa | 99.8 /100 | #54 | Exceptional 98.3% |
| Immigrants | Scotland | 99.8 /100 | #55 | Exceptional 98.3% |
| Americans | 99.8 /100 | #56 | Exceptional 98.3% |
| Austrians | 99.8 /100 | #57 | Exceptional 98.3% |
| Bulgarians | 99.8 /100 | #58 | Exceptional 98.3% |
| Slavs | 99.8 /100 | #59 | Exceptional 98.3% |
Demographics Similar to Immigrants from Sri Lanka by 2nd Grade
In terms of 2nd grade, the demographic groups most similar to Immigrants from Sri Lanka are Immigrants from Micronesia (97.9%, a difference of 0.0%), Immigrants from Bosnia and Herzegovina (97.9%, a difference of 0.0%), Albanian (97.9%, a difference of 0.010%), Immigrants from Korea (97.9%, a difference of 0.010%), and Kenyan (97.9%, a difference of 0.010%).
| Demographics | Rating | Rank | 2nd Grade |
| Immigrants | Spain | 55.4 /100 | #169 | Average 97.9% |
| Navajo | 54.3 /100 | #170 | Average 97.9% |
| Albanians | 52.8 /100 | #171 | Average 97.9% |
| Immigrants | Korea | 52.7 /100 | #172 | Average 97.9% |
| Kenyans | 52.7 /100 | #173 | Average 97.9% |
| Immigrants | Micronesia | 50.0 /100 | #174 | Average 97.9% |
| Immigrants | Bosnia and Herzegovina | 49.8 /100 | #175 | Average 97.9% |
| Immigrants | Sri Lanka | 48.7 /100 | #176 | Average 97.9% |
| Immigrants | Brazil | 46.6 /100 | #177 | Average 97.9% |
| Argentineans | 46.3 /100 | #178 | Average 97.9% |
| Immigrants | Venezuela | 46.1 /100 | #179 | Average 97.9% |
| Natives/Alaskans | 44.3 /100 | #180 | Average 97.9% |
| Egyptians | 44.3 /100 | #181 | Average 97.9% |
| Portuguese | 42.4 /100 | #182 | Average 97.8% |
| Immigrants | Poland | 42.2 /100 | #183 | Average 97.8% |