Bahamian vs Immigrants from Sri Lanka 2nd Grade
COMPARE
Bahamian
Immigrants from Sri Lanka
2nd Grade
2nd Grade Comparison
Bahamians
Immigrants from Sri Lanka
97.7%
2ND GRADE
6.8/ 100
METRIC RATING
215th/ 347
METRIC RANK
97.9%
2ND GRADE
48.7/ 100
METRIC RATING
176th/ 347
METRIC RANK
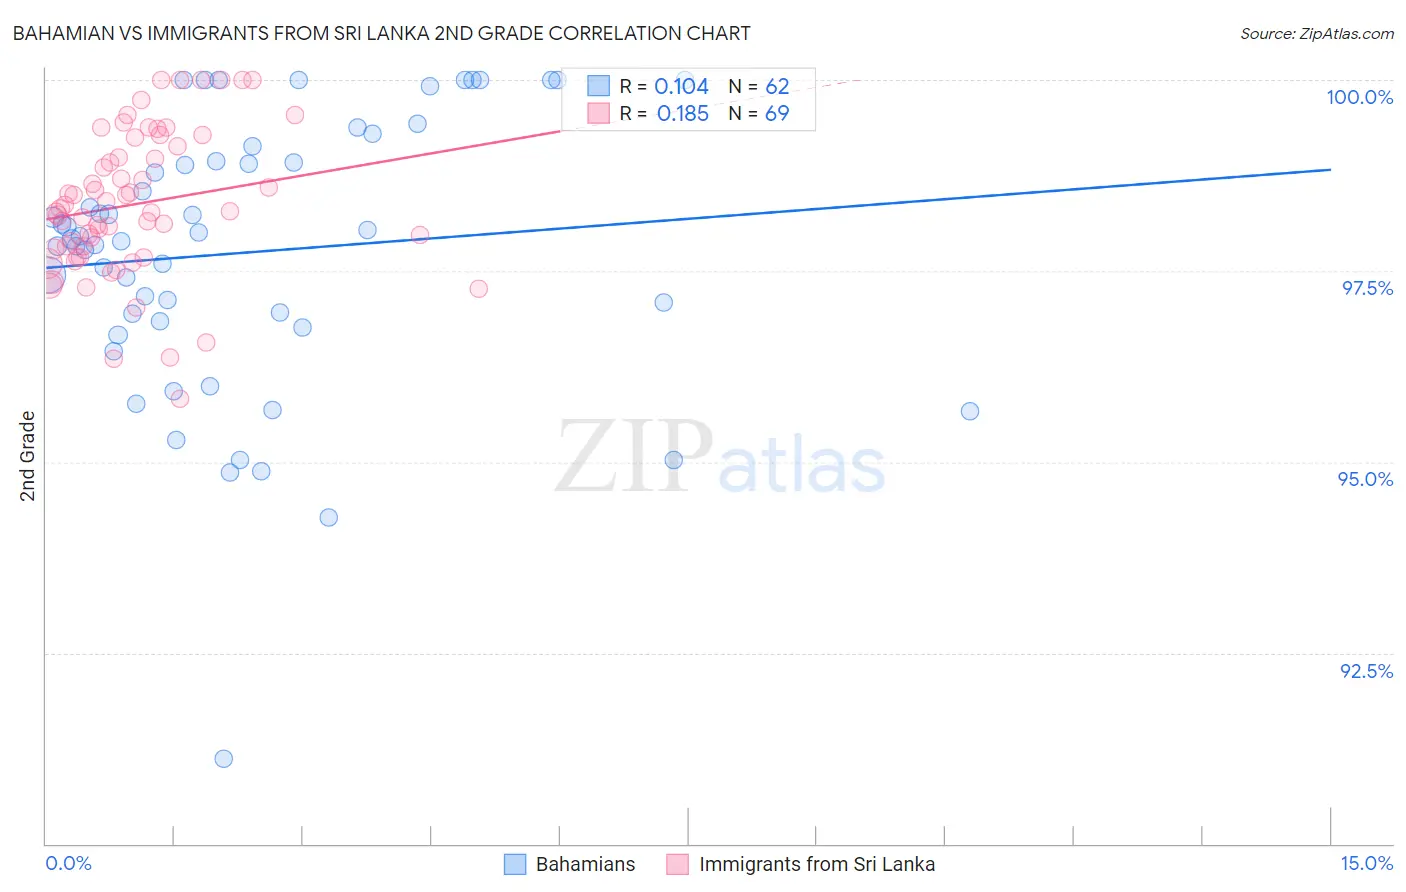
Bahamian vs Immigrants from Sri Lanka 2nd Grade Correlation Chart
The statistical analysis conducted on geographies consisting of 112,673,855 people shows a poor positive correlation between the proportion of Bahamians and percentage of population with at least 2nd grade education in the United States with a correlation coefficient (R) of 0.104 and weighted average of 97.7%. Similarly, the statistical analysis conducted on geographies consisting of 149,700,552 people shows a poor positive correlation between the proportion of Immigrants from Sri Lanka and percentage of population with at least 2nd grade education in the United States with a correlation coefficient (R) of 0.185 and weighted average of 97.9%, a difference of 0.20%.
2nd Grade Correlation Summary
| Measurement | Bahamian | Immigrants from Sri Lanka |
| Minimum | 91.1% | 95.8% |
| Maximum | 100.0% | 100.0% |
| Range | 8.9% | 4.2% |
| Mean | 97.7% | 98.4% |
| Median | 97.9% | 98.3% |
| Interquartile 25% (IQ1) | 96.8% | 97.7% |
| Interquartile 75% (IQ3) | 98.9% | 99.2% |
| Interquartile Range (IQR) | 2.1% | 1.5% |
| Standard Deviation (Sample) | 1.8% | 0.95% |
| Standard Deviation (Population) | 1.8% | 0.94% |
Similar Demographics by 2nd Grade
Demographics Similar to Bahamians by 2nd Grade
In terms of 2nd grade, the demographic groups most similar to Bahamians are Samoan (97.7%, a difference of 0.0%), South American Indian (97.7%, a difference of 0.0%), Uruguayan (97.7%, a difference of 0.010%), Immigrants from Bahamas (97.7%, a difference of 0.020%), and Moroccan (97.7%, a difference of 0.020%).
| Demographics | Rating | Rank | 2nd Grade |
| Immigrants | Northern Africa | 12.3 /100 | #208 | Poor 97.7% |
| Immigrants | Oceania | 10.9 /100 | #209 | Poor 97.7% |
| Costa Ricans | 10.5 /100 | #210 | Poor 97.7% |
| Laotians | 9.9 /100 | #211 | Tragic 97.7% |
| Immigrants | Bahamas | 8.4 /100 | #212 | Tragic 97.7% |
| Moroccans | 8.2 /100 | #213 | Tragic 97.7% |
| Samoans | 7.1 /100 | #214 | Tragic 97.7% |
| Bahamians | 6.8 /100 | #215 | Tragic 97.7% |
| South American Indians | 6.7 /100 | #216 | Tragic 97.7% |
| Uruguayans | 6.2 /100 | #217 | Tragic 97.7% |
| Sudanese | 5.7 /100 | #218 | Tragic 97.7% |
| Immigrants | Panama | 5.1 /100 | #219 | Tragic 97.6% |
| Immigrants | Morocco | 5.0 /100 | #220 | Tragic 97.6% |
| Iraqis | 4.6 /100 | #221 | Tragic 97.6% |
| Immigrants | Sudan | 4.5 /100 | #222 | Tragic 97.6% |
Demographics Similar to Immigrants from Sri Lanka by 2nd Grade
In terms of 2nd grade, the demographic groups most similar to Immigrants from Sri Lanka are Immigrants from Micronesia (97.9%, a difference of 0.0%), Immigrants from Bosnia and Herzegovina (97.9%, a difference of 0.0%), Albanian (97.9%, a difference of 0.010%), Immigrants from Korea (97.9%, a difference of 0.010%), and Kenyan (97.9%, a difference of 0.010%).
| Demographics | Rating | Rank | 2nd Grade |
| Immigrants | Spain | 55.4 /100 | #169 | Average 97.9% |
| Navajo | 54.3 /100 | #170 | Average 97.9% |
| Albanians | 52.8 /100 | #171 | Average 97.9% |
| Immigrants | Korea | 52.7 /100 | #172 | Average 97.9% |
| Kenyans | 52.7 /100 | #173 | Average 97.9% |
| Immigrants | Micronesia | 50.0 /100 | #174 | Average 97.9% |
| Immigrants | Bosnia and Herzegovina | 49.8 /100 | #175 | Average 97.9% |
| Immigrants | Sri Lanka | 48.7 /100 | #176 | Average 97.9% |
| Immigrants | Brazil | 46.6 /100 | #177 | Average 97.9% |
| Argentineans | 46.3 /100 | #178 | Average 97.9% |
| Immigrants | Venezuela | 46.1 /100 | #179 | Average 97.9% |
| Natives/Alaskans | 44.3 /100 | #180 | Average 97.9% |
| Egyptians | 44.3 /100 | #181 | Average 97.9% |
| Portuguese | 42.4 /100 | #182 | Average 97.8% |
| Immigrants | Poland | 42.2 /100 | #183 | Average 97.8% |