Immigrants from Laos vs Immigrants from Hong Kong Kindergarten
COMPARE
Immigrants from Laos
Immigrants from Hong Kong
Kindergarten
Kindergarten Comparison
Immigrants from Laos
Immigrants from Hong Kong
96.9%
KINDERGARTEN
0.0/ 100
METRIC RATING
318th/ 347
METRIC RANK
97.3%
KINDERGARTEN
0.0/ 100
METRIC RATING
287th/ 347
METRIC RANK
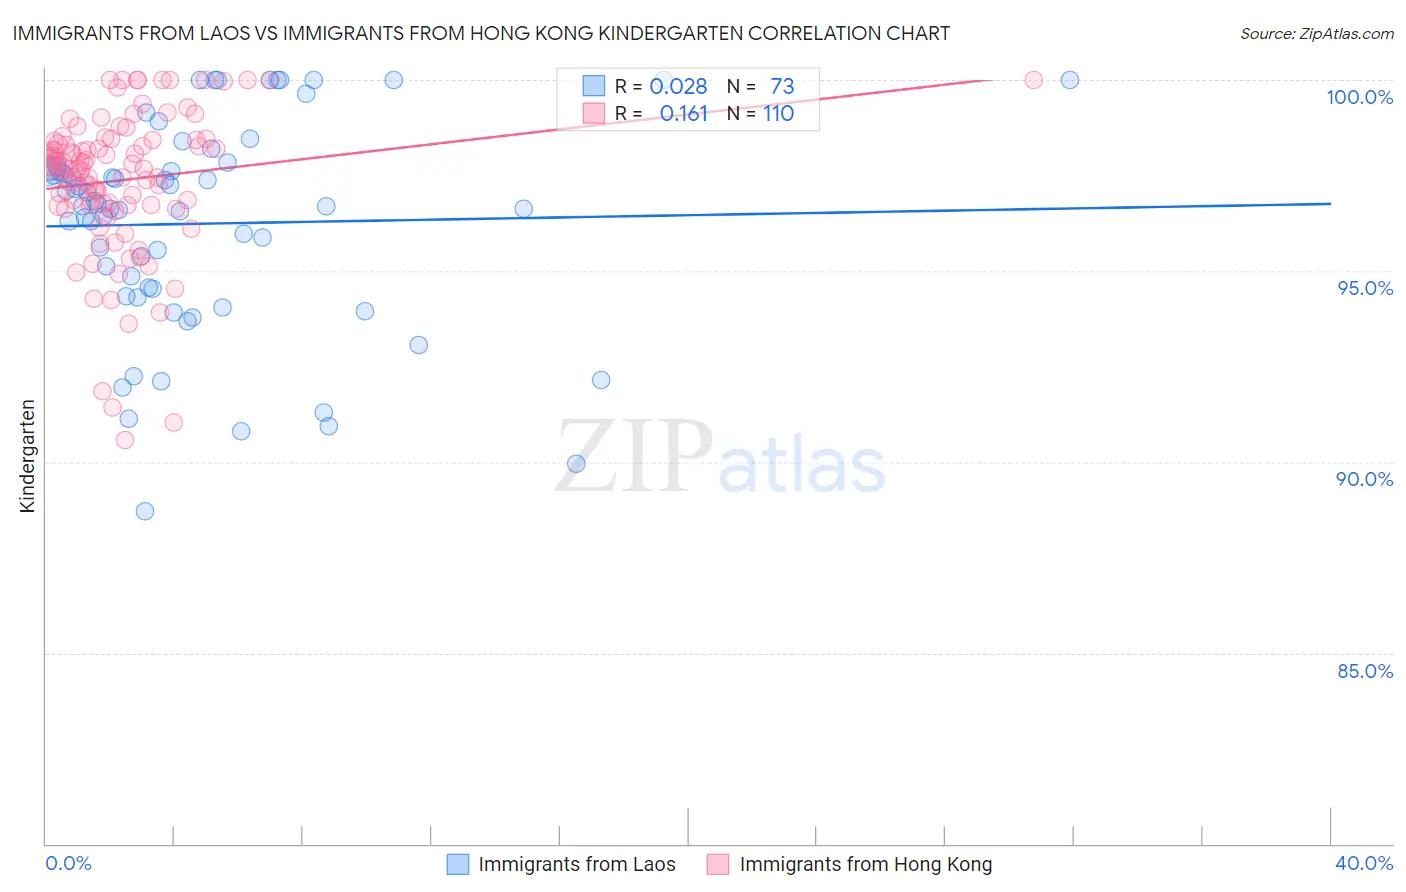
Immigrants from Laos vs Immigrants from Hong Kong Kindergarten Correlation Chart
The statistical analysis conducted on geographies consisting of 201,453,273 people shows no correlation between the proportion of Immigrants from Laos and percentage of population with at least kindergarten education in the United States with a correlation coefficient (R) of 0.028 and weighted average of 96.9%. Similarly, the statistical analysis conducted on geographies consisting of 253,948,669 people shows a poor positive correlation between the proportion of Immigrants from Hong Kong and percentage of population with at least kindergarten education in the United States with a correlation coefficient (R) of 0.161 and weighted average of 97.3%, a difference of 0.48%.
Kindergarten Correlation Summary
| Measurement | Immigrants from Laos | Immigrants from Hong Kong |
| Minimum | 88.7% | 90.6% |
| Maximum | 100.0% | 100.0% |
| Range | 11.3% | 9.4% |
| Mean | 96.2% | 97.4% |
| Median | 96.7% | 97.7% |
| Interquartile 25% (IQ1) | 94.4% | 96.7% |
| Interquartile 75% (IQ3) | 97.7% | 98.4% |
| Interquartile Range (IQR) | 3.3% | 1.7% |
| Standard Deviation (Sample) | 2.7% | 1.9% |
| Standard Deviation (Population) | 2.7% | 1.9% |
Similar Demographics by Kindergarten
Demographics Similar to Immigrants from Laos by Kindergarten
In terms of kindergarten, the demographic groups most similar to Immigrants from Laos are Immigrants from Guyana (96.8%, a difference of 0.010%), Immigrants from Burma/Myanmar (96.8%, a difference of 0.010%), Immigrants from Bangladesh (96.8%, a difference of 0.020%), Mexican American Indian (96.8%, a difference of 0.030%), and Immigrants from Honduras (96.8%, a difference of 0.040%).
| Demographics | Rating | Rank | Kindergarten |
| Sri Lankans | 0.0 /100 | #311 | Tragic 97.0% |
| Guyanese | 0.0 /100 | #312 | Tragic 96.9% |
| Cape Verdeans | 0.0 /100 | #313 | Tragic 96.9% |
| Hondurans | 0.0 /100 | #314 | Tragic 96.9% |
| Immigrants | Belize | 0.0 /100 | #315 | Tragic 96.9% |
| Immigrants | Nicaragua | 0.0 /100 | #316 | Tragic 96.9% |
| Immigrants | Ecuador | 0.0 /100 | #317 | Tragic 96.9% |
| Immigrants | Laos | 0.0 /100 | #318 | Tragic 96.9% |
| Immigrants | Guyana | 0.0 /100 | #319 | Tragic 96.8% |
| Immigrants | Burma/Myanmar | 0.0 /100 | #320 | Tragic 96.8% |
| Immigrants | Bangladesh | 0.0 /100 | #321 | Tragic 96.8% |
| Mexican American Indians | 0.0 /100 | #322 | Tragic 96.8% |
| Immigrants | Honduras | 0.0 /100 | #323 | Tragic 96.8% |
| Vietnamese | 0.0 /100 | #324 | Tragic 96.8% |
| Indonesians | 0.0 /100 | #325 | Tragic 96.8% |
Demographics Similar to Immigrants from Hong Kong by Kindergarten
In terms of kindergarten, the demographic groups most similar to Immigrants from Hong Kong are Immigrants from Barbados (97.3%, a difference of 0.0%), Immigrants from Portugal (97.3%, a difference of 0.010%), Immigrants from Thailand (97.3%, a difference of 0.010%), Immigrants from Trinidad and Tobago (97.3%, a difference of 0.020%), and Immigrants from West Indies (97.3%, a difference of 0.030%).
| Demographics | Rating | Rank | Kindergarten |
| Barbadians | 0.1 /100 | #280 | Tragic 97.4% |
| Trinidadians and Tobagonians | 0.1 /100 | #281 | Tragic 97.4% |
| Afghans | 0.0 /100 | #282 | Tragic 97.4% |
| Immigrants | West Indies | 0.0 /100 | #283 | Tragic 97.3% |
| Immigrants | Trinidad and Tobago | 0.0 /100 | #284 | Tragic 97.3% |
| Immigrants | Portugal | 0.0 /100 | #285 | Tragic 97.3% |
| Immigrants | Barbados | 0.0 /100 | #286 | Tragic 97.3% |
| Immigrants | Hong Kong | 0.0 /100 | #287 | Tragic 97.3% |
| Immigrants | Thailand | 0.0 /100 | #288 | Tragic 97.3% |
| Immigrants | Afghanistan | 0.0 /100 | #289 | Tragic 97.3% |
| Immigrants | St. Vincent and the Grenadines | 0.0 /100 | #290 | Tragic 97.3% |
| Houma | 0.0 /100 | #291 | Tragic 97.3% |
| British West Indians | 0.0 /100 | #292 | Tragic 97.3% |
| Malaysians | 0.0 /100 | #293 | Tragic 97.2% |
| Immigrants | Immigrants | 0.0 /100 | #294 | Tragic 97.2% |