Immigrants from Caribbean vs Immigrants from Hong Kong Kindergarten
COMPARE
Immigrants from Caribbean
Immigrants from Hong Kong
Kindergarten
Kindergarten Comparison
Immigrants from Caribbean
Immigrants from Hong Kong
97.1%
KINDERGARTEN
0.0/ 100
METRIC RATING
302nd/ 347
METRIC RANK
97.3%
KINDERGARTEN
0.0/ 100
METRIC RATING
287th/ 347
METRIC RANK
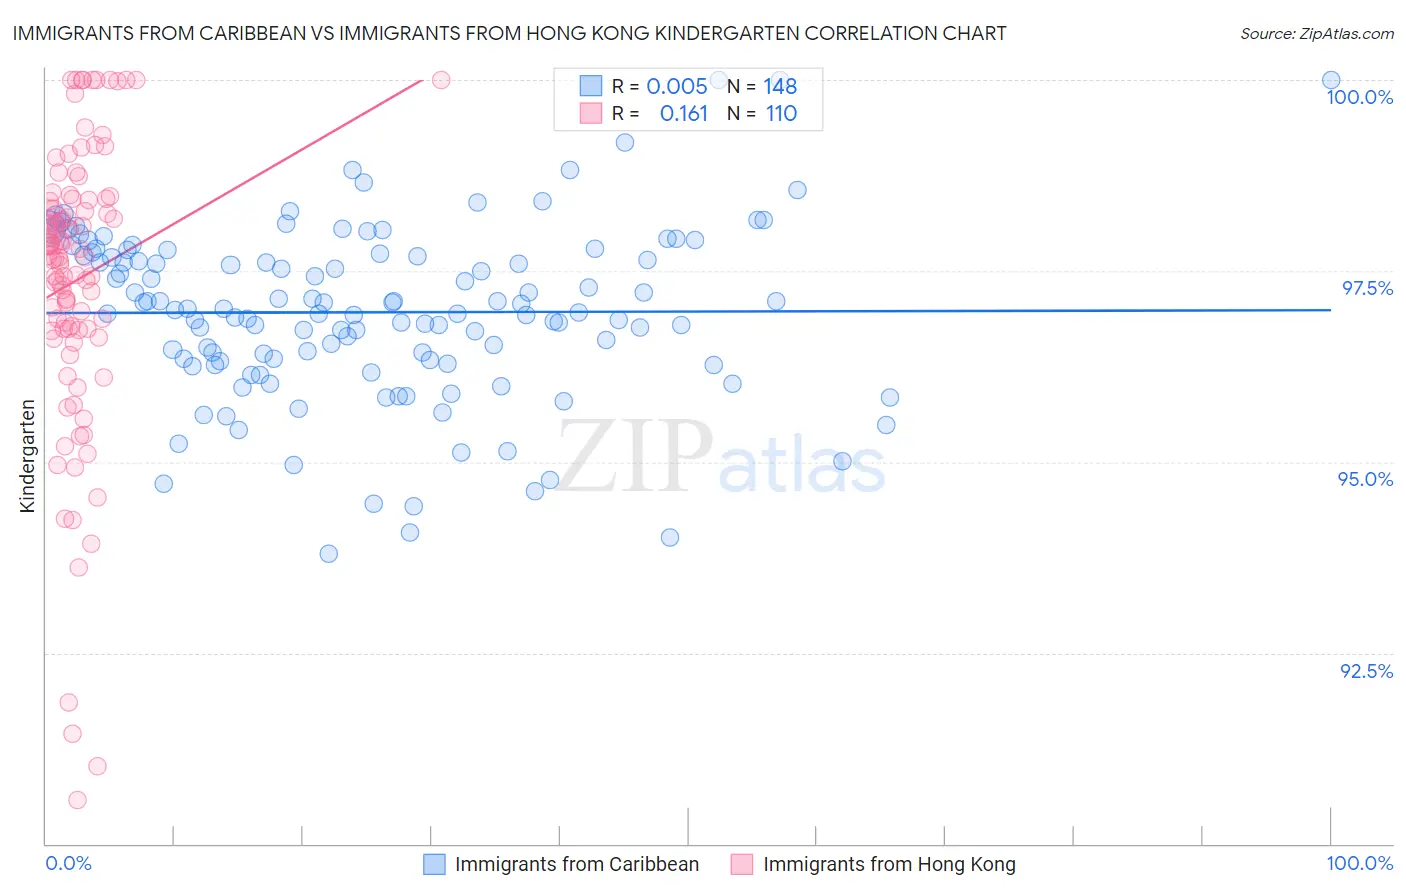
Immigrants from Caribbean vs Immigrants from Hong Kong Kindergarten Correlation Chart
The statistical analysis conducted on geographies consisting of 449,948,226 people shows no correlation between the proportion of Immigrants from Caribbean and percentage of population with at least kindergarten education in the United States with a correlation coefficient (R) of 0.005 and weighted average of 97.1%. Similarly, the statistical analysis conducted on geographies consisting of 253,948,669 people shows a poor positive correlation between the proportion of Immigrants from Hong Kong and percentage of population with at least kindergarten education in the United States with a correlation coefficient (R) of 0.161 and weighted average of 97.3%, a difference of 0.25%.
Kindergarten Correlation Summary
| Measurement | Immigrants from Caribbean | Immigrants from Hong Kong |
| Minimum | 93.8% | 90.6% |
| Maximum | 100.0% | 100.0% |
| Range | 6.2% | 9.4% |
| Mean | 97.0% | 97.4% |
| Median | 97.0% | 97.7% |
| Interquartile 25% (IQ1) | 96.3% | 96.7% |
| Interquartile 75% (IQ3) | 97.7% | 98.4% |
| Interquartile Range (IQR) | 1.4% | 1.7% |
| Standard Deviation (Sample) | 1.1% | 1.9% |
| Standard Deviation (Population) | 1.1% | 1.9% |
Demographics Similar to Immigrants from Caribbean and Immigrants from Hong Kong by Kindergarten
In terms of kindergarten, the demographic groups most similar to Immigrants from Caribbean are Immigrants from South Eastern Asia (97.1%, a difference of 0.030%), Somali (97.0%, a difference of 0.040%), Nicaraguan (97.0%, a difference of 0.040%), Haitian (97.1%, a difference of 0.050%), and Immigrants from Dominica (97.1%, a difference of 0.060%). Similarly, the demographic groups most similar to Immigrants from Hong Kong are Immigrants from Barbados (97.3%, a difference of 0.0%), Immigrants from Portugal (97.3%, a difference of 0.010%), Immigrants from Thailand (97.3%, a difference of 0.010%), Immigrants from Trinidad and Tobago (97.3%, a difference of 0.020%), and Immigrants from Afghanistan (97.3%, a difference of 0.030%).
| Demographics | Rating | Rank | Kindergarten |
| Immigrants | Trinidad and Tobago | 0.0 /100 | #284 | Tragic 97.3% |
| Immigrants | Portugal | 0.0 /100 | #285 | Tragic 97.3% |
| Immigrants | Barbados | 0.0 /100 | #286 | Tragic 97.3% |
| Immigrants | Hong Kong | 0.0 /100 | #287 | Tragic 97.3% |
| Immigrants | Thailand | 0.0 /100 | #288 | Tragic 97.3% |
| Immigrants | Afghanistan | 0.0 /100 | #289 | Tragic 97.3% |
| Immigrants | St. Vincent and the Grenadines | 0.0 /100 | #290 | Tragic 97.3% |
| Houma | 0.0 /100 | #291 | Tragic 97.3% |
| British West Indians | 0.0 /100 | #292 | Tragic 97.3% |
| Malaysians | 0.0 /100 | #293 | Tragic 97.2% |
| Immigrants | Immigrants | 0.0 /100 | #294 | Tragic 97.2% |
| Immigrants | Grenada | 0.0 /100 | #295 | Tragic 97.2% |
| Immigrants | Eritrea | 0.0 /100 | #296 | Tragic 97.2% |
| Central American Indians | 0.0 /100 | #297 | Tragic 97.2% |
| Immigrants | Dominica | 0.0 /100 | #298 | Tragic 97.1% |
| Immigrants | Cuba | 0.0 /100 | #299 | Tragic 97.1% |
| Haitians | 0.0 /100 | #300 | Tragic 97.1% |
| Immigrants | South Eastern Asia | 0.0 /100 | #301 | Tragic 97.1% |
| Immigrants | Caribbean | 0.0 /100 | #302 | Tragic 97.1% |
| Somalis | 0.0 /100 | #303 | Tragic 97.0% |
| Nicaraguans | 0.0 /100 | #304 | Tragic 97.0% |