Immigrants from Laos vs Immigrants from Hong Kong Unemployment Among Ages 55 to 59 years
COMPARE
Immigrants from Laos
Immigrants from Hong Kong
Unemployment Among Ages 55 to 59 years
Unemployment Among Ages 55 to 59 years Comparison
Immigrants from Laos
Immigrants from Hong Kong
4.7%
UNEMPLOYMENT AMONG AGES 55 TO 59 YEARS
93.9/ 100
METRIC RATING
106th/ 347
METRIC RANK
5.0%
UNEMPLOYMENT AMONG AGES 55 TO 59 YEARS
1.4/ 100
METRIC RATING
235th/ 347
METRIC RANK
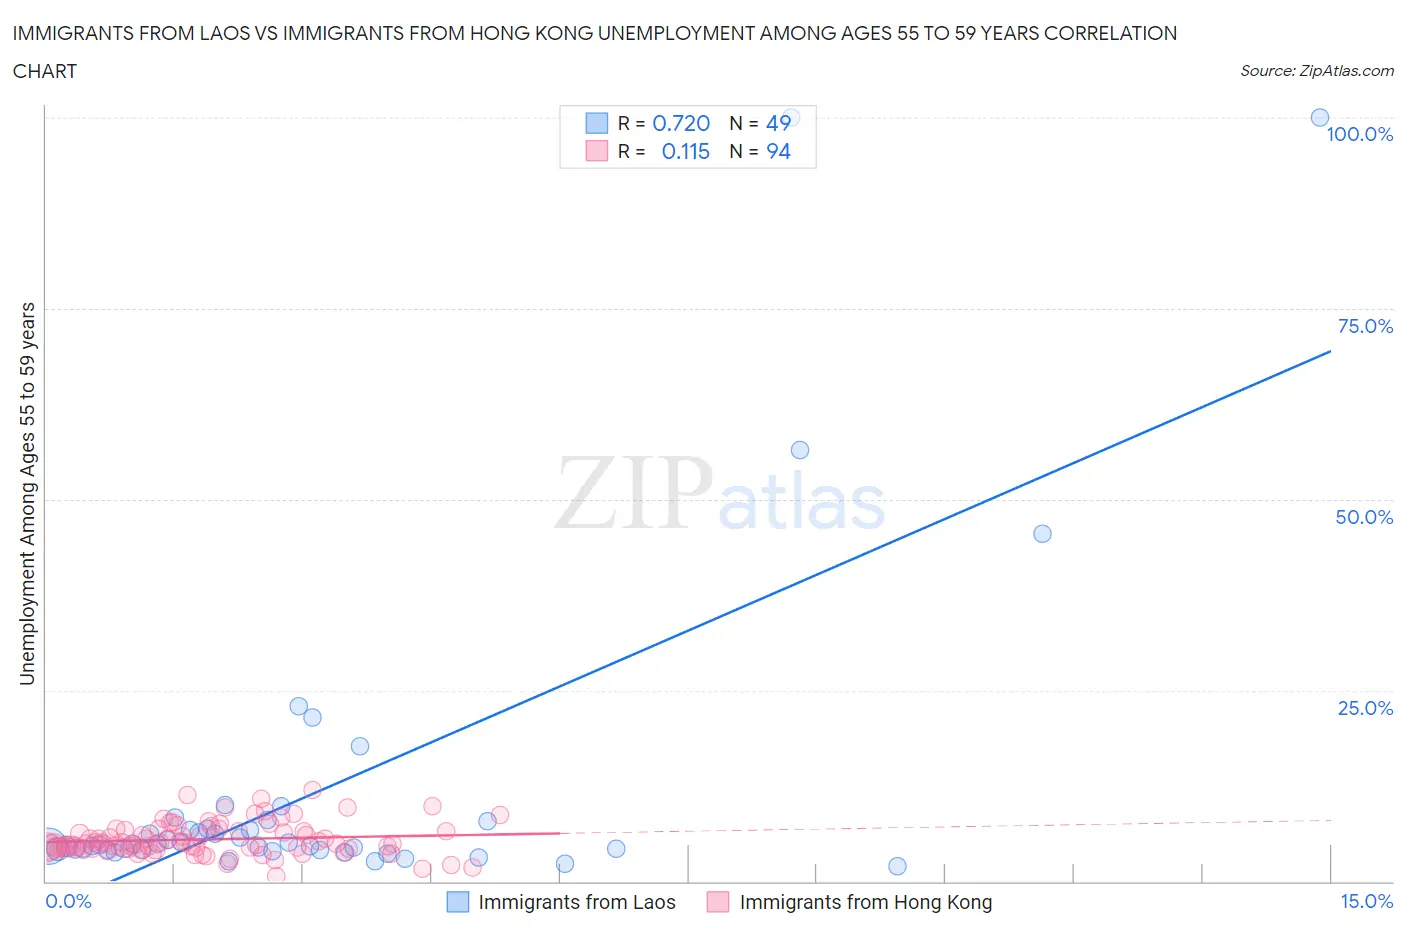
Immigrants from Laos vs Immigrants from Hong Kong Unemployment Among Ages 55 to 59 years Correlation Chart
The statistical analysis conducted on geographies consisting of 193,806,599 people shows a strong positive correlation between the proportion of Immigrants from Laos and unemployment rate among population between the ages 55 and 59 in the United States with a correlation coefficient (R) of 0.720 and weighted average of 4.7%. Similarly, the statistical analysis conducted on geographies consisting of 245,156,987 people shows a poor positive correlation between the proportion of Immigrants from Hong Kong and unemployment rate among population between the ages 55 and 59 in the United States with a correlation coefficient (R) of 0.115 and weighted average of 5.0%, a difference of 7.3%.
Unemployment Among Ages 55 to 59 years Correlation Summary
| Measurement | Immigrants from Laos | Immigrants from Hong Kong |
| Minimum | 2.0% | 0.60% |
| Maximum | 100.0% | 11.9% |
| Range | 98.0% | 11.3% |
| Mean | 11.7% | 5.5% |
| Median | 4.7% | 4.9% |
| Interquartile 25% (IQ1) | 4.1% | 4.4% |
| Interquartile 75% (IQ3) | 7.4% | 6.6% |
| Interquartile Range (IQR) | 3.2% | 2.3% |
| Standard Deviation (Sample) | 20.9% | 2.1% |
| Standard Deviation (Population) | 20.7% | 2.1% |
Similar Demographics by Unemployment Among Ages 55 to 59 years
Demographics Similar to Immigrants from Laos by Unemployment Among Ages 55 to 59 years
In terms of unemployment among ages 55 to 59 years, the demographic groups most similar to Immigrants from Laos are Immigrants from North America (4.7%, a difference of 0.010%), Immigrants from Turkey (4.7%, a difference of 0.020%), Canadian (4.7%, a difference of 0.040%), Immigrants from Oceania (4.7%, a difference of 0.040%), and Immigrants from Egypt (4.7%, a difference of 0.060%).
| Demographics | Rating | Rank | Unemployment Among Ages 55 to 59 years |
| Yugoslavians | 94.7 /100 | #99 | Exceptional 4.7% |
| Serbians | 94.4 /100 | #100 | Exceptional 4.7% |
| Celtics | 94.3 /100 | #101 | Exceptional 4.7% |
| Canadians | 94.1 /100 | #102 | Exceptional 4.7% |
| Immigrants | Oceania | 94.0 /100 | #103 | Exceptional 4.7% |
| Immigrants | Turkey | 93.9 /100 | #104 | Exceptional 4.7% |
| Immigrants | North America | 93.9 /100 | #105 | Exceptional 4.7% |
| Immigrants | Laos | 93.9 /100 | #106 | Exceptional 4.7% |
| Immigrants | Egypt | 93.5 /100 | #107 | Exceptional 4.7% |
| French | 93.3 /100 | #108 | Exceptional 4.7% |
| Chileans | 93.2 /100 | #109 | Exceptional 4.7% |
| Egyptians | 92.9 /100 | #110 | Exceptional 4.7% |
| Austrians | 92.4 /100 | #111 | Exceptional 4.7% |
| Afghans | 92.1 /100 | #112 | Exceptional 4.7% |
| Immigrants | Spain | 91.4 /100 | #113 | Exceptional 4.7% |
Demographics Similar to Immigrants from Hong Kong by Unemployment Among Ages 55 to 59 years
In terms of unemployment among ages 55 to 59 years, the demographic groups most similar to Immigrants from Hong Kong are Immigrants from Albania (5.0%, a difference of 0.11%), Choctaw (5.0%, a difference of 0.11%), Moroccan (5.0%, a difference of 0.14%), French American Indian (5.0%, a difference of 0.15%), and Immigrants from Southern Europe (5.0%, a difference of 0.23%).
| Demographics | Rating | Rank | Unemployment Among Ages 55 to 59 years |
| Immigrants | Liberia | 3.2 /100 | #228 | Tragic 5.0% |
| Immigrants | Western Asia | 3.0 /100 | #229 | Tragic 5.0% |
| Immigrants | Syria | 2.7 /100 | #230 | Tragic 5.0% |
| Cherokee | 2.6 /100 | #231 | Tragic 5.0% |
| Albanians | 2.5 /100 | #232 | Tragic 5.0% |
| Immigrants | Immigrants | 2.3 /100 | #233 | Tragic 5.0% |
| Immigrants | Southern Europe | 1.8 /100 | #234 | Tragic 5.0% |
| Immigrants | Hong Kong | 1.4 /100 | #235 | Tragic 5.0% |
| Immigrants | Albania | 1.3 /100 | #236 | Tragic 5.0% |
| Choctaw | 1.3 /100 | #237 | Tragic 5.0% |
| Moroccans | 1.3 /100 | #238 | Tragic 5.0% |
| French American Indians | 1.2 /100 | #239 | Tragic 5.0% |
| Immigrants | Costa Rica | 1.1 /100 | #240 | Tragic 5.0% |
| Brazilians | 1.0 /100 | #241 | Tragic 5.0% |
| Liberians | 0.9 /100 | #242 | Tragic 5.1% |