Immigrants from Laos vs Immigrants from Asia Bachelor's Degree
COMPARE
Immigrants from Laos
Immigrants from Asia
Bachelor's Degree
Bachelor's Degree Comparison
Immigrants from Laos
Immigrants from Asia
31.6%
BACHELOR'S DEGREE
0.1/ 100
METRIC RATING
280th/ 347
METRIC RANK
44.3%
BACHELOR'S DEGREE
99.9/ 100
METRIC RATING
53rd/ 347
METRIC RANK
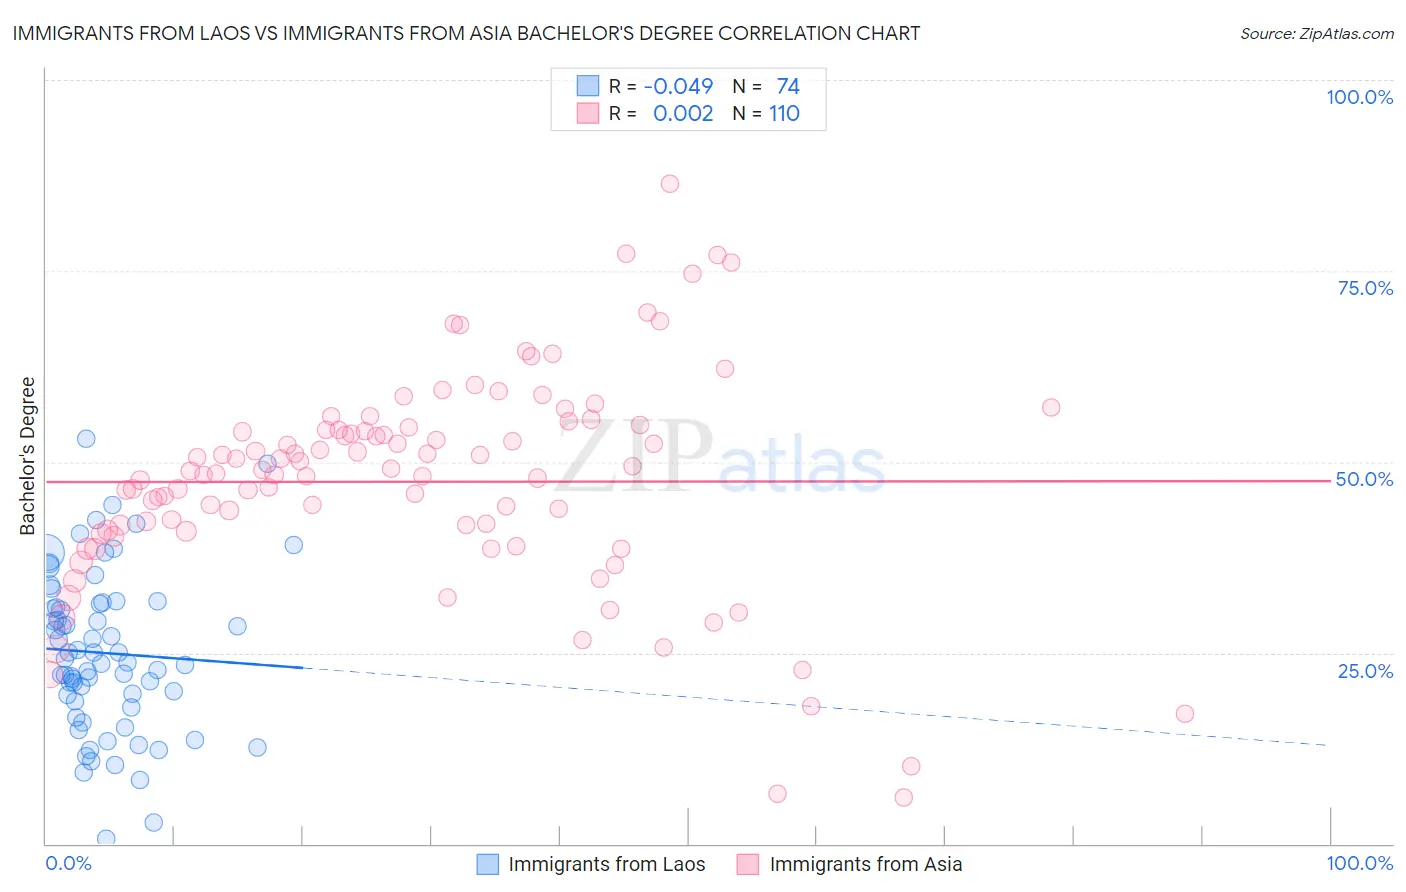
Immigrants from Laos vs Immigrants from Asia Bachelor's Degree Correlation Chart
The statistical analysis conducted on geographies consisting of 201,474,630 people shows no correlation between the proportion of Immigrants from Laos and percentage of population with at least bachelor's degree education in the United States with a correlation coefficient (R) of -0.049 and weighted average of 31.6%. Similarly, the statistical analysis conducted on geographies consisting of 549,058,309 people shows no correlation between the proportion of Immigrants from Asia and percentage of population with at least bachelor's degree education in the United States with a correlation coefficient (R) of 0.002 and weighted average of 44.3%, a difference of 40.1%.
Bachelor's Degree Correlation Summary
| Measurement | Immigrants from Laos | Immigrants from Asia |
| Minimum | 0.64% | 6.0% |
| Maximum | 53.0% | 86.4% |
| Range | 52.4% | 80.4% |
| Mean | 25.0% | 47.4% |
| Median | 24.0% | 48.6% |
| Interquartile 25% (IQ1) | 18.6% | 40.9% |
| Interquartile 75% (IQ3) | 31.5% | 54.2% |
| Interquartile Range (IQR) | 12.9% | 13.3% |
| Standard Deviation (Sample) | 10.5% | 14.2% |
| Standard Deviation (Population) | 10.4% | 14.1% |
Similar Demographics by Bachelor's Degree
Demographics Similar to Immigrants from Laos by Bachelor's Degree
In terms of bachelor's degree, the demographic groups most similar to Immigrants from Laos are Hawaiian (31.6%, a difference of 0.050%), Marshallese (31.7%, a difference of 0.40%), Dominican (31.8%, a difference of 0.45%), Blackfeet (31.5%, a difference of 0.46%), and Salvadoran (31.8%, a difference of 0.60%).
| Demographics | Rating | Rank | Bachelor's Degree |
| Americans | 0.2 /100 | #273 | Tragic 31.9% |
| Potawatomi | 0.2 /100 | #274 | Tragic 31.9% |
| Samoans | 0.1 /100 | #275 | Tragic 31.8% |
| Salvadorans | 0.1 /100 | #276 | Tragic 31.8% |
| Dominicans | 0.1 /100 | #277 | Tragic 31.8% |
| Marshallese | 0.1 /100 | #278 | Tragic 31.7% |
| Hawaiians | 0.1 /100 | #279 | Tragic 31.6% |
| Immigrants | Laos | 0.1 /100 | #280 | Tragic 31.6% |
| Blackfeet | 0.1 /100 | #281 | Tragic 31.5% |
| Immigrants | Caribbean | 0.1 /100 | #282 | Tragic 31.4% |
| Hondurans | 0.1 /100 | #283 | Tragic 31.3% |
| Haitians | 0.1 /100 | #284 | Tragic 31.3% |
| Aleuts | 0.1 /100 | #285 | Tragic 31.3% |
| Immigrants | El Salvador | 0.1 /100 | #286 | Tragic 31.3% |
| Ottawa | 0.1 /100 | #287 | Tragic 31.1% |
Demographics Similar to Immigrants from Asia by Bachelor's Degree
In terms of bachelor's degree, the demographic groups most similar to Immigrants from Asia are Immigrants from Spain (44.3%, a difference of 0.060%), Immigrants from Austria (44.2%, a difference of 0.19%), Immigrants from Bolivia (44.2%, a difference of 0.19%), Asian (44.4%, a difference of 0.24%), and Immigrants from Serbia (44.1%, a difference of 0.37%).
| Demographics | Rating | Rank | Bachelor's Degree |
| Immigrants | Bulgaria | 99.9 /100 | #46 | Exceptional 44.6% |
| Bolivians | 99.9 /100 | #47 | Exceptional 44.6% |
| Estonians | 99.9 /100 | #48 | Exceptional 44.6% |
| Immigrants | Norway | 99.9 /100 | #49 | Exceptional 44.5% |
| Immigrants | Greece | 99.9 /100 | #50 | Exceptional 44.5% |
| Asians | 99.9 /100 | #51 | Exceptional 44.4% |
| Immigrants | Spain | 99.9 /100 | #52 | Exceptional 44.3% |
| Immigrants | Asia | 99.9 /100 | #53 | Exceptional 44.3% |
| Immigrants | Austria | 99.9 /100 | #54 | Exceptional 44.2% |
| Immigrants | Bolivia | 99.9 /100 | #55 | Exceptional 44.2% |
| Immigrants | Serbia | 99.9 /100 | #56 | Exceptional 44.1% |
| Paraguayans | 99.9 /100 | #57 | Exceptional 44.0% |
| Immigrants | Czechoslovakia | 99.9 /100 | #58 | Exceptional 44.0% |
| Australians | 99.9 /100 | #59 | Exceptional 44.0% |
| New Zealanders | 99.9 /100 | #60 | Exceptional 44.0% |