Immigrants from Laos vs Immigrants from Asia 3rd Grade
COMPARE
Immigrants from Laos
Immigrants from Asia
3rd Grade
3rd Grade Comparison
Immigrants from Laos
Immigrants from Asia
96.6%
3RD GRADE
0.0/ 100
METRIC RATING
312th/ 347
METRIC RANK
97.4%
3RD GRADE
0.8/ 100
METRIC RATING
251st/ 347
METRIC RANK
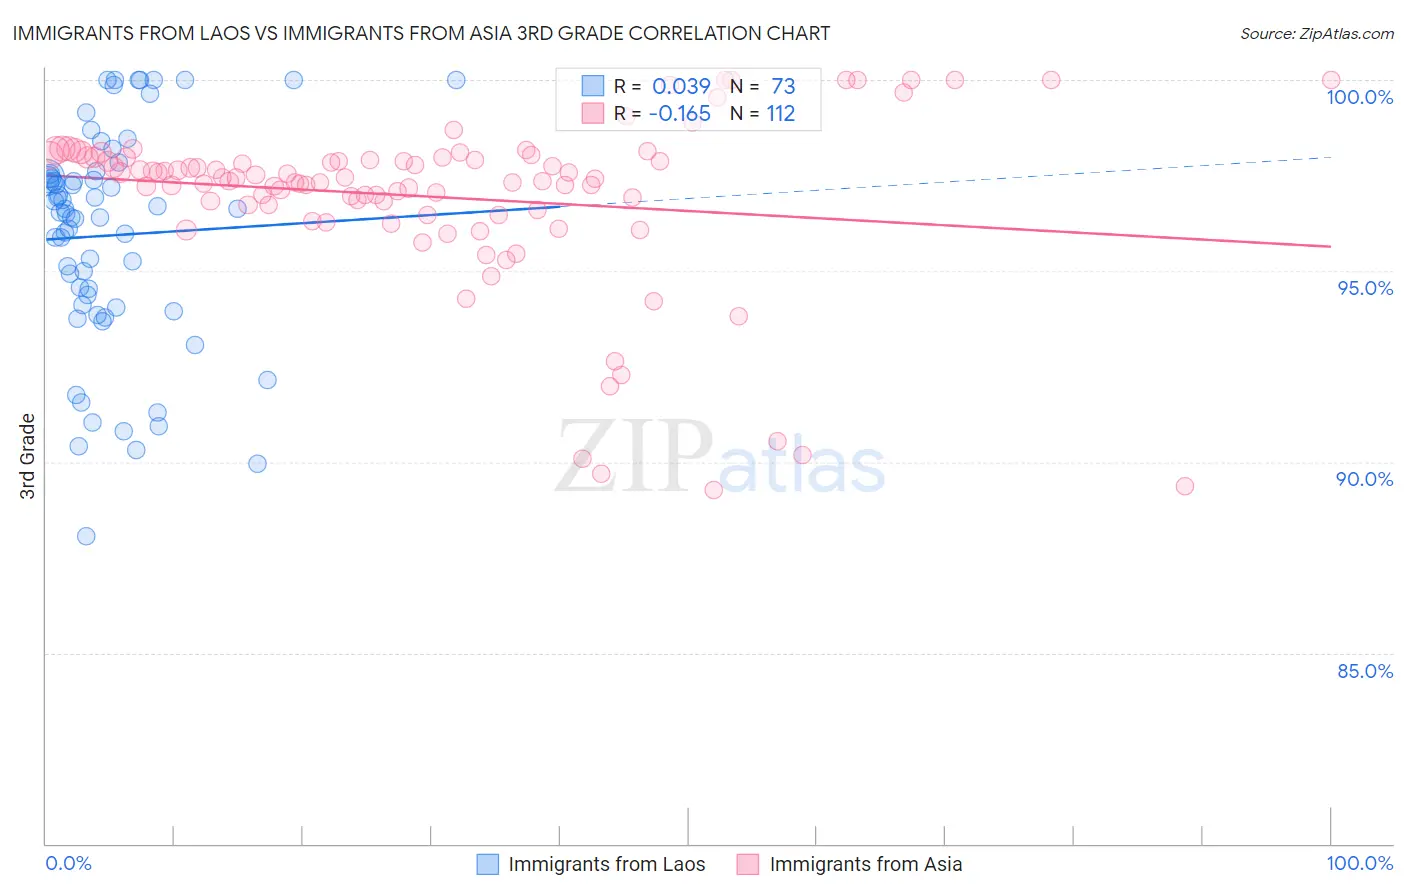
Immigrants from Laos vs Immigrants from Asia 3rd Grade Correlation Chart
The statistical analysis conducted on geographies consisting of 201,453,273 people shows no correlation between the proportion of Immigrants from Laos and percentage of population with at least 3rd grade education in the United States with a correlation coefficient (R) of 0.039 and weighted average of 96.6%. Similarly, the statistical analysis conducted on geographies consisting of 549,170,269 people shows a poor negative correlation between the proportion of Immigrants from Asia and percentage of population with at least 3rd grade education in the United States with a correlation coefficient (R) of -0.165 and weighted average of 97.4%, a difference of 0.79%.
3rd Grade Correlation Summary
| Measurement | Immigrants from Laos | Immigrants from Asia |
| Minimum | 88.0% | 89.3% |
| Maximum | 100.0% | 100.0% |
| Range | 12.0% | 10.7% |
| Mean | 95.9% | 96.9% |
| Median | 96.5% | 97.4% |
| Interquartile 25% (IQ1) | 94.1% | 96.7% |
| Interquartile 75% (IQ3) | 97.5% | 98.0% |
| Interquartile Range (IQR) | 3.4% | 1.3% |
| Standard Deviation (Sample) | 2.9% | 2.2% |
| Standard Deviation (Population) | 2.8% | 2.2% |
Similar Demographics by 3rd Grade
Demographics Similar to Immigrants from Laos by 3rd Grade
In terms of 3rd grade, the demographic groups most similar to Immigrants from Laos are Immigrants from Ecuador (96.6%, a difference of 0.010%), Belizean (96.6%, a difference of 0.010%), Immigrants from Guyana (96.6%, a difference of 0.020%), Immigrants from the Azores (96.6%, a difference of 0.020%), and Immigrants from Burma/Myanmar (96.6%, a difference of 0.030%).
| Demographics | Rating | Rank | 3rd Grade |
| Central American Indians | 0.0 /100 | #305 | Tragic 96.7% |
| Guyanese | 0.0 /100 | #306 | Tragic 96.7% |
| Nicaraguans | 0.0 /100 | #307 | Tragic 96.7% |
| Immigrants | Haiti | 0.0 /100 | #308 | Tragic 96.7% |
| Sri Lankans | 0.0 /100 | #309 | Tragic 96.7% |
| Cape Verdeans | 0.0 /100 | #310 | Tragic 96.6% |
| Immigrants | Guyana | 0.0 /100 | #311 | Tragic 96.6% |
| Immigrants | Laos | 0.0 /100 | #312 | Tragic 96.6% |
| Immigrants | Ecuador | 0.0 /100 | #313 | Tragic 96.6% |
| Belizeans | 0.0 /100 | #314 | Tragic 96.6% |
| Immigrants | Azores | 0.0 /100 | #315 | Tragic 96.6% |
| Immigrants | Burma/Myanmar | 0.0 /100 | #316 | Tragic 96.6% |
| Immigrants | Bangladesh | 0.0 /100 | #317 | Tragic 96.6% |
| Hispanics or Latinos | 0.0 /100 | #318 | Tragic 96.5% |
| Vietnamese | 0.0 /100 | #319 | Tragic 96.5% |
Demographics Similar to Immigrants from Asia by 3rd Grade
In terms of 3rd grade, the demographic groups most similar to Immigrants from Asia are Immigrants from Middle Africa (97.4%, a difference of 0.0%), Peruvian (97.4%, a difference of 0.0%), Immigrants from Africa (97.4%, a difference of 0.0%), Immigrants from Senegal (97.4%, a difference of 0.010%), and Assyrian/Chaldean/Syriac (97.4%, a difference of 0.010%).
| Demographics | Rating | Rank | 3rd Grade |
| Asians | 1.1 /100 | #244 | Tragic 97.4% |
| Ethiopians | 1.1 /100 | #245 | Tragic 97.4% |
| Immigrants | Senegal | 1.0 /100 | #246 | Tragic 97.4% |
| Assyrians/Chaldeans/Syriacs | 1.0 /100 | #247 | Tragic 97.4% |
| Immigrants | Eastern Africa | 0.9 /100 | #248 | Tragic 97.4% |
| South Americans | 0.9 /100 | #249 | Tragic 97.4% |
| Immigrants | Middle Africa | 0.9 /100 | #250 | Tragic 97.4% |
| Immigrants | Asia | 0.8 /100 | #251 | Tragic 97.4% |
| Peruvians | 0.8 /100 | #252 | Tragic 97.4% |
| Immigrants | Africa | 0.8 /100 | #253 | Tragic 97.4% |
| Jamaicans | 0.7 /100 | #254 | Tragic 97.4% |
| Bolivians | 0.6 /100 | #255 | Tragic 97.3% |
| Immigrants | Congo | 0.6 /100 | #256 | Tragic 97.3% |
| Immigrants | Colombia | 0.5 /100 | #257 | Tragic 97.3% |
| Immigrants | Liberia | 0.5 /100 | #258 | Tragic 97.3% |