Immigrants from Laos vs Immigrants from Nicaragua Bachelor's Degree
COMPARE
Immigrants from Laos
Immigrants from Nicaragua
Bachelor's Degree
Bachelor's Degree Comparison
Immigrants from Laos
Immigrants from Nicaragua
31.6%
BACHELOR'S DEGREE
0.1/ 100
METRIC RATING
280th/ 347
METRIC RANK
31.9%
BACHELOR'S DEGREE
0.2/ 100
METRIC RATING
270th/ 347
METRIC RANK
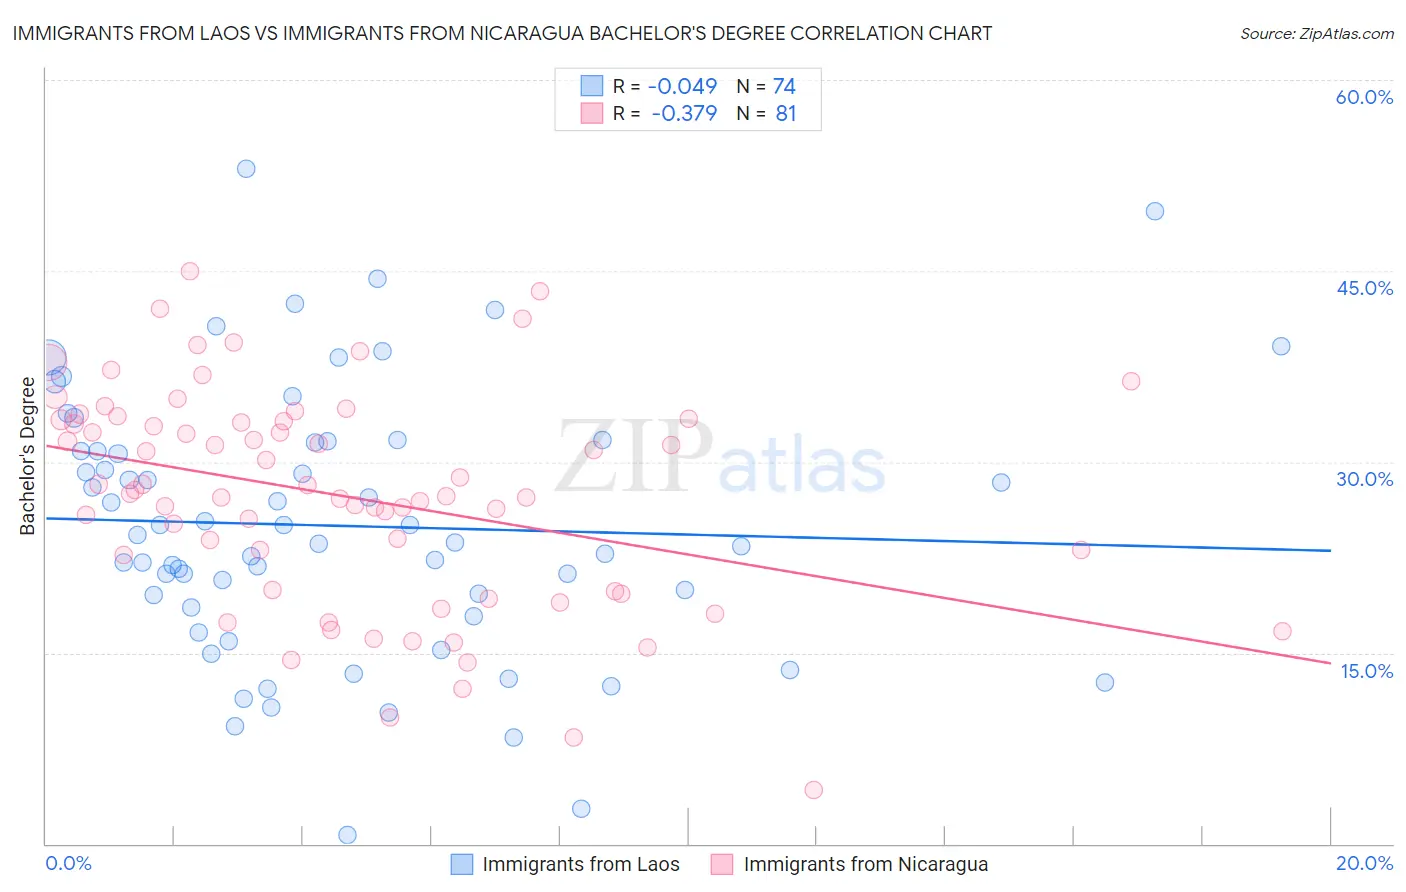
Immigrants from Laos vs Immigrants from Nicaragua Bachelor's Degree Correlation Chart
The statistical analysis conducted on geographies consisting of 201,474,630 people shows no correlation between the proportion of Immigrants from Laos and percentage of population with at least bachelor's degree education in the United States with a correlation coefficient (R) of -0.049 and weighted average of 31.6%. Similarly, the statistical analysis conducted on geographies consisting of 236,337,877 people shows a mild negative correlation between the proportion of Immigrants from Nicaragua and percentage of population with at least bachelor's degree education in the United States with a correlation coefficient (R) of -0.379 and weighted average of 31.9%, a difference of 1.0%.
Bachelor's Degree Correlation Summary
| Measurement | Immigrants from Laos | Immigrants from Nicaragua |
| Minimum | 0.64% | 4.3% |
| Maximum | 53.0% | 45.0% |
| Range | 52.4% | 40.7% |
| Mean | 25.0% | 27.2% |
| Median | 24.0% | 27.5% |
| Interquartile 25% (IQ1) | 18.6% | 19.9% |
| Interquartile 75% (IQ3) | 31.5% | 33.3% |
| Interquartile Range (IQR) | 12.9% | 13.3% |
| Standard Deviation (Sample) | 10.5% | 8.5% |
| Standard Deviation (Population) | 10.4% | 8.5% |
Demographics Similar to Immigrants from Laos and Immigrants from Nicaragua by Bachelor's Degree
In terms of bachelor's degree, the demographic groups most similar to Immigrants from Laos are Hawaiian (31.6%, a difference of 0.050%), Marshallese (31.7%, a difference of 0.40%), Dominican (31.8%, a difference of 0.45%), Blackfeet (31.5%, a difference of 0.46%), and Salvadoran (31.8%, a difference of 0.60%). Similarly, the demographic groups most similar to Immigrants from Nicaragua are Central American (31.9%, a difference of 0.090%), Comanche (31.9%, a difference of 0.12%), American (31.9%, a difference of 0.24%), Potawatomi (31.9%, a difference of 0.27%), and Samoan (31.8%, a difference of 0.40%).
| Demographics | Rating | Rank | Bachelor's Degree |
| Bahamians | 0.3 /100 | #265 | Tragic 32.5% |
| Immigrants | Dominica | 0.3 /100 | #266 | Tragic 32.5% |
| Cubans | 0.3 /100 | #267 | Tragic 32.5% |
| Immigrants | Portugal | 0.2 /100 | #268 | Tragic 32.2% |
| Immigrants | Belize | 0.2 /100 | #269 | Tragic 32.1% |
| Immigrants | Nicaragua | 0.2 /100 | #270 | Tragic 31.9% |
| Central Americans | 0.2 /100 | #271 | Tragic 31.9% |
| Comanche | 0.2 /100 | #272 | Tragic 31.9% |
| Americans | 0.2 /100 | #273 | Tragic 31.9% |
| Potawatomi | 0.2 /100 | #274 | Tragic 31.9% |
| Samoans | 0.1 /100 | #275 | Tragic 31.8% |
| Salvadorans | 0.1 /100 | #276 | Tragic 31.8% |
| Dominicans | 0.1 /100 | #277 | Tragic 31.8% |
| Marshallese | 0.1 /100 | #278 | Tragic 31.7% |
| Hawaiians | 0.1 /100 | #279 | Tragic 31.6% |
| Immigrants | Laos | 0.1 /100 | #280 | Tragic 31.6% |
| Blackfeet | 0.1 /100 | #281 | Tragic 31.5% |
| Immigrants | Caribbean | 0.1 /100 | #282 | Tragic 31.4% |
| Hondurans | 0.1 /100 | #283 | Tragic 31.3% |
| Haitians | 0.1 /100 | #284 | Tragic 31.3% |
| Aleuts | 0.1 /100 | #285 | Tragic 31.3% |