Immigrants from Ethiopia vs Blackfeet Master's Degree
COMPARE
Immigrants from Ethiopia
Blackfeet
Master's Degree
Master's Degree Comparison
Immigrants from Ethiopia
Blackfeet
17.9%
MASTER'S DEGREE
99.8/ 100
METRIC RATING
68th/ 347
METRIC RANK
12.1%
MASTER'S DEGREE
0.3/ 100
METRIC RATING
273rd/ 347
METRIC RANK
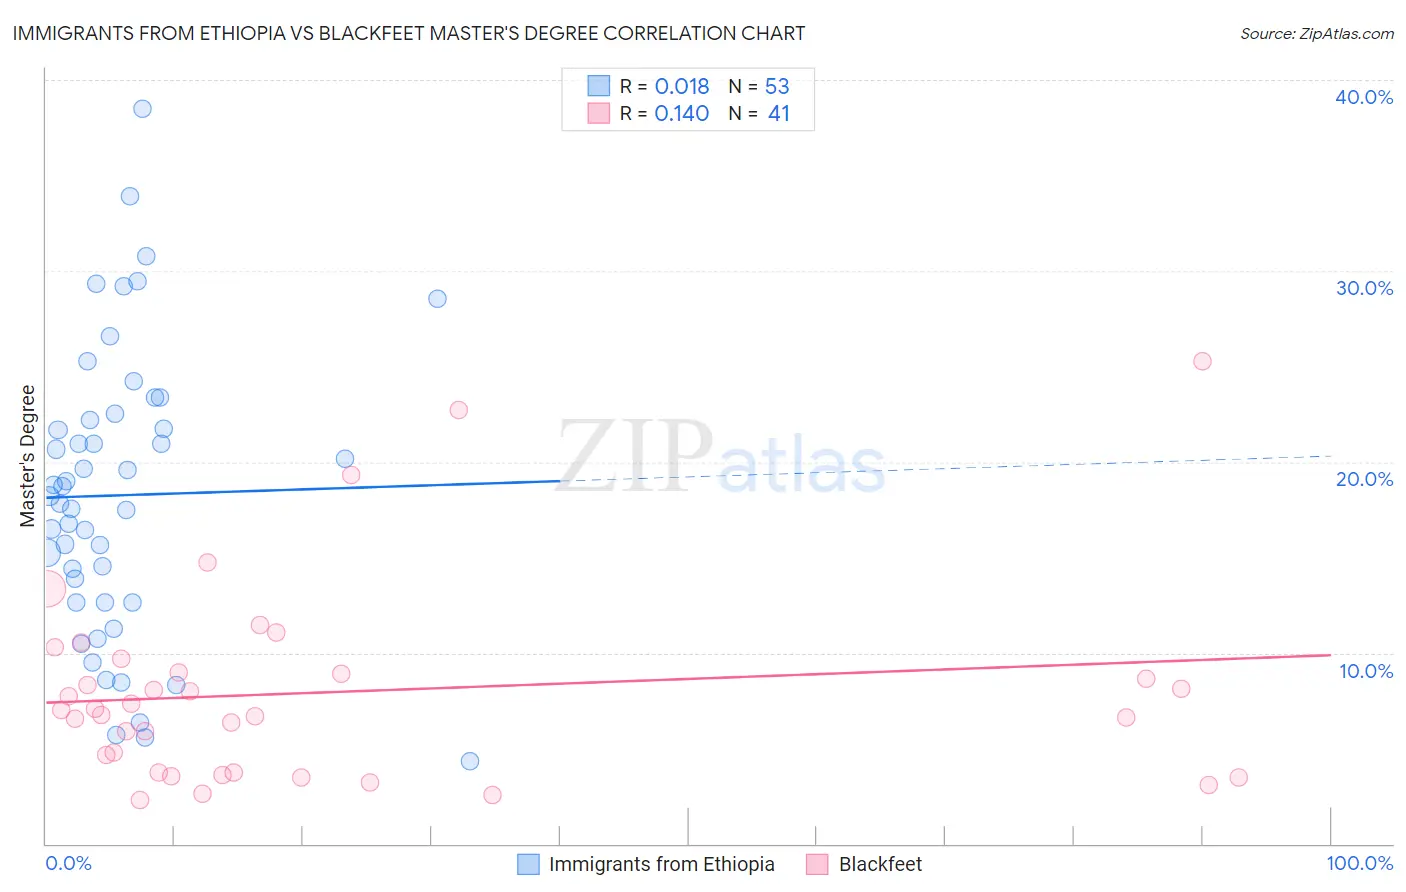
Immigrants from Ethiopia vs Blackfeet Master's Degree Correlation Chart
The statistical analysis conducted on geographies consisting of 211,528,614 people shows no correlation between the proportion of Immigrants from Ethiopia and percentage of population with at least master's degree education in the United States with a correlation coefficient (R) of 0.018 and weighted average of 17.9%. Similarly, the statistical analysis conducted on geographies consisting of 309,479,249 people shows a poor positive correlation between the proportion of Blackfeet and percentage of population with at least master's degree education in the United States with a correlation coefficient (R) of 0.140 and weighted average of 12.1%, a difference of 48.3%.
Master's Degree Correlation Summary
| Measurement | Immigrants from Ethiopia | Blackfeet |
| Minimum | 4.3% | 2.3% |
| Maximum | 38.5% | 25.2% |
| Range | 34.2% | 22.9% |
| Mean | 18.2% | 7.9% |
| Median | 18.2% | 7.0% |
| Interquartile 25% (IQ1) | 12.6% | 3.7% |
| Interquartile 75% (IQ3) | 22.4% | 9.3% |
| Interquartile Range (IQR) | 9.8% | 5.6% |
| Standard Deviation (Sample) | 7.5% | 5.1% |
| Standard Deviation (Population) | 7.5% | 5.1% |
Similar Demographics by Master's Degree
Demographics Similar to Immigrants from Ethiopia by Master's Degree
In terms of master's degree, the demographic groups most similar to Immigrants from Ethiopia are Immigrants from Argentina (18.0%, a difference of 0.23%), Ethiopian (18.0%, a difference of 0.27%), Immigrants from Kazakhstan (18.0%, a difference of 0.30%), Immigrants from Uzbekistan (17.9%, a difference of 0.33%), and Immigrants from Western Europe (17.8%, a difference of 0.54%).
| Demographics | Rating | Rank | Master's Degree |
| Immigrants | Europe | 99.9 /100 | #61 | Exceptional 18.2% |
| Argentineans | 99.9 /100 | #62 | Exceptional 18.2% |
| Immigrants | Netherlands | 99.9 /100 | #63 | Exceptional 18.1% |
| South Africans | 99.9 /100 | #64 | Exceptional 18.1% |
| Immigrants | Kazakhstan | 99.8 /100 | #65 | Exceptional 18.0% |
| Ethiopians | 99.8 /100 | #66 | Exceptional 18.0% |
| Immigrants | Argentina | 99.8 /100 | #67 | Exceptional 18.0% |
| Immigrants | Ethiopia | 99.8 /100 | #68 | Exceptional 17.9% |
| Immigrants | Uzbekistan | 99.8 /100 | #69 | Exceptional 17.9% |
| Immigrants | Western Europe | 99.8 /100 | #70 | Exceptional 17.8% |
| Immigrants | Pakistan | 99.7 /100 | #71 | Exceptional 17.8% |
| Lithuanians | 99.7 /100 | #72 | Exceptional 17.7% |
| Zimbabweans | 99.7 /100 | #73 | Exceptional 17.7% |
| Immigrants | Romania | 99.7 /100 | #74 | Exceptional 17.7% |
| Egyptians | 99.6 /100 | #75 | Exceptional 17.6% |
Demographics Similar to Blackfeet by Master's Degree
In terms of master's degree, the demographic groups most similar to Blackfeet are Comanche (12.1%, a difference of 0.090%), Cape Verdean (12.1%, a difference of 0.090%), Cuban (12.1%, a difference of 0.10%), Haitian (12.1%, a difference of 0.15%), and Black/African American (12.1%, a difference of 0.16%).
| Demographics | Rating | Rank | Master's Degree |
| Bahamians | 0.5 /100 | #266 | Tragic 12.4% |
| Americans | 0.4 /100 | #267 | Tragic 12.3% |
| Native Hawaiians | 0.4 /100 | #268 | Tragic 12.3% |
| Central Americans | 0.3 /100 | #269 | Tragic 12.2% |
| Salvadorans | 0.3 /100 | #270 | Tragic 12.2% |
| Haitians | 0.3 /100 | #271 | Tragic 12.1% |
| Comanche | 0.3 /100 | #272 | Tragic 12.1% |
| Blackfeet | 0.3 /100 | #273 | Tragic 12.1% |
| Cape Verdeans | 0.3 /100 | #274 | Tragic 12.1% |
| Cubans | 0.3 /100 | #275 | Tragic 12.1% |
| Blacks/African Americans | 0.3 /100 | #276 | Tragic 12.1% |
| Immigrants | Caribbean | 0.3 /100 | #277 | Tragic 12.1% |
| Potawatomi | 0.3 /100 | #278 | Tragic 12.1% |
| Immigrants | Belize | 0.2 /100 | #279 | Tragic 12.1% |
| Immigrants | Dominican Republic | 0.2 /100 | #280 | Tragic 12.1% |