Immigrants from Kenya vs Puerto Rican 6th Grade
COMPARE
Immigrants from Kenya
Puerto Rican
6th Grade
6th Grade Comparison
Immigrants from Kenya
Puerto Ricans
97.0%
6TH GRADE
45.3/ 100
METRIC RATING
179th/ 347
METRIC RANK
95.5%
6TH GRADE
0.0/ 100
METRIC RATING
309th/ 347
METRIC RANK
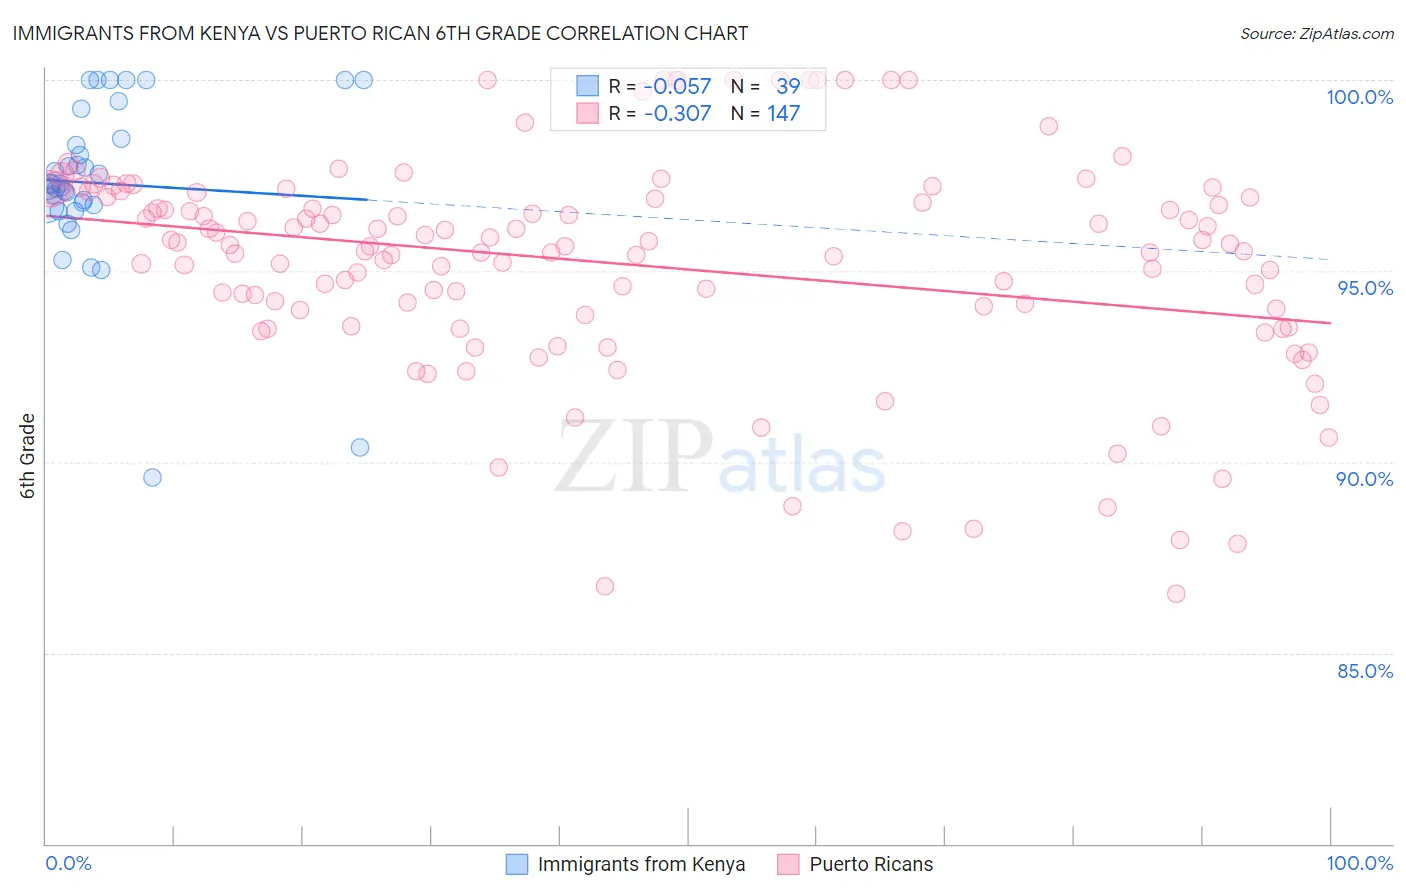
Immigrants from Kenya vs Puerto Rican 6th Grade Correlation Chart
The statistical analysis conducted on geographies consisting of 218,076,690 people shows a slight negative correlation between the proportion of Immigrants from Kenya and percentage of population with at least 6th grade education in the United States with a correlation coefficient (R) of -0.057 and weighted average of 97.0%. Similarly, the statistical analysis conducted on geographies consisting of 528,320,438 people shows a mild negative correlation between the proportion of Puerto Ricans and percentage of population with at least 6th grade education in the United States with a correlation coefficient (R) of -0.307 and weighted average of 95.5%, a difference of 1.6%.
6th Grade Correlation Summary
| Measurement | Immigrants from Kenya | Puerto Rican |
| Minimum | 89.6% | 86.6% |
| Maximum | 100.0% | 100.0% |
| Range | 10.4% | 13.4% |
| Mean | 97.3% | 95.2% |
| Median | 97.3% | 95.7% |
| Interquartile 25% (IQ1) | 96.7% | 93.8% |
| Interquartile 75% (IQ3) | 98.5% | 96.9% |
| Interquartile Range (IQR) | 1.7% | 3.1% |
| Standard Deviation (Sample) | 2.2% | 2.9% |
| Standard Deviation (Population) | 2.2% | 2.8% |
Similar Demographics by 6th Grade
Demographics Similar to Immigrants from Kenya by 6th Grade
In terms of 6th grade, the demographic groups most similar to Immigrants from Kenya are Pakistani (97.0%, a difference of 0.0%), Immigrants from Kazakhstan (97.0%, a difference of 0.010%), Immigrants from Micronesia (97.0%, a difference of 0.010%), Mongolian (97.0%, a difference of 0.010%), and Arab (97.0%, a difference of 0.020%).
| Demographics | Rating | Rank | 6th Grade |
| Egyptians | 50.9 /100 | #172 | Average 97.1% |
| Arabs | 50.1 /100 | #173 | Average 97.0% |
| Venezuelans | 50.0 /100 | #174 | Average 97.0% |
| Immigrants | Kazakhstan | 47.3 /100 | #175 | Average 97.0% |
| Immigrants | Micronesia | 47.1 /100 | #176 | Average 97.0% |
| Mongolians | 46.7 /100 | #177 | Average 97.0% |
| Pakistanis | 46.0 /100 | #178 | Average 97.0% |
| Immigrants | Kenya | 45.3 /100 | #179 | Average 97.0% |
| Immigrants | Spain | 39.9 /100 | #180 | Fair 97.0% |
| Comanche | 37.9 /100 | #181 | Fair 97.0% |
| Immigrants | Ukraine | 35.6 /100 | #182 | Fair 97.0% |
| Immigrants | Venezuela | 34.5 /100 | #183 | Fair 97.0% |
| Spanish Americans | 33.5 /100 | #184 | Fair 97.0% |
| Argentineans | 33.0 /100 | #185 | Fair 97.0% |
| Immigrants | Egypt | 31.4 /100 | #186 | Fair 97.0% |
Demographics Similar to Puerto Ricans by 6th Grade
In terms of 6th grade, the demographic groups most similar to Puerto Ricans are Ecuadorian (95.5%, a difference of 0.010%), Immigrants from Portugal (95.5%, a difference of 0.030%), Immigrants from Guyana (95.5%, a difference of 0.040%), Immigrants from Caribbean (95.6%, a difference of 0.050%), and Guyanese (95.6%, a difference of 0.060%).
| Demographics | Rating | Rank | 6th Grade |
| Immigrants | Burma/Myanmar | 0.0 /100 | #302 | Tragic 95.7% |
| Bangladeshis | 0.0 /100 | #303 | Tragic 95.7% |
| Indonesians | 0.0 /100 | #304 | Tragic 95.6% |
| Immigrants | Cuba | 0.0 /100 | #305 | Tragic 95.6% |
| Immigrants | Haiti | 0.0 /100 | #306 | Tragic 95.6% |
| Guyanese | 0.0 /100 | #307 | Tragic 95.6% |
| Immigrants | Caribbean | 0.0 /100 | #308 | Tragic 95.6% |
| Puerto Ricans | 0.0 /100 | #309 | Tragic 95.5% |
| Ecuadorians | 0.0 /100 | #310 | Tragic 95.5% |
| Immigrants | Portugal | 0.0 /100 | #311 | Tragic 95.5% |
| Immigrants | Guyana | 0.0 /100 | #312 | Tragic 95.5% |
| Nicaraguans | 0.0 /100 | #313 | Tragic 95.4% |
| Immigrants | Vietnam | 0.0 /100 | #314 | Tragic 95.4% |
| Immigrants | Bangladesh | 0.0 /100 | #315 | Tragic 95.4% |
| Japanese | 0.0 /100 | #316 | Tragic 95.4% |