Immigrants from Hong Kong vs Puerto Rican 6th Grade
COMPARE
Immigrants from Hong Kong
Puerto Rican
6th Grade
6th Grade Comparison
Immigrants from Hong Kong
Puerto Ricans
96.3%
6TH GRADE
0.2/ 100
METRIC RATING
271st/ 347
METRIC RANK
95.5%
6TH GRADE
0.0/ 100
METRIC RATING
309th/ 347
METRIC RANK
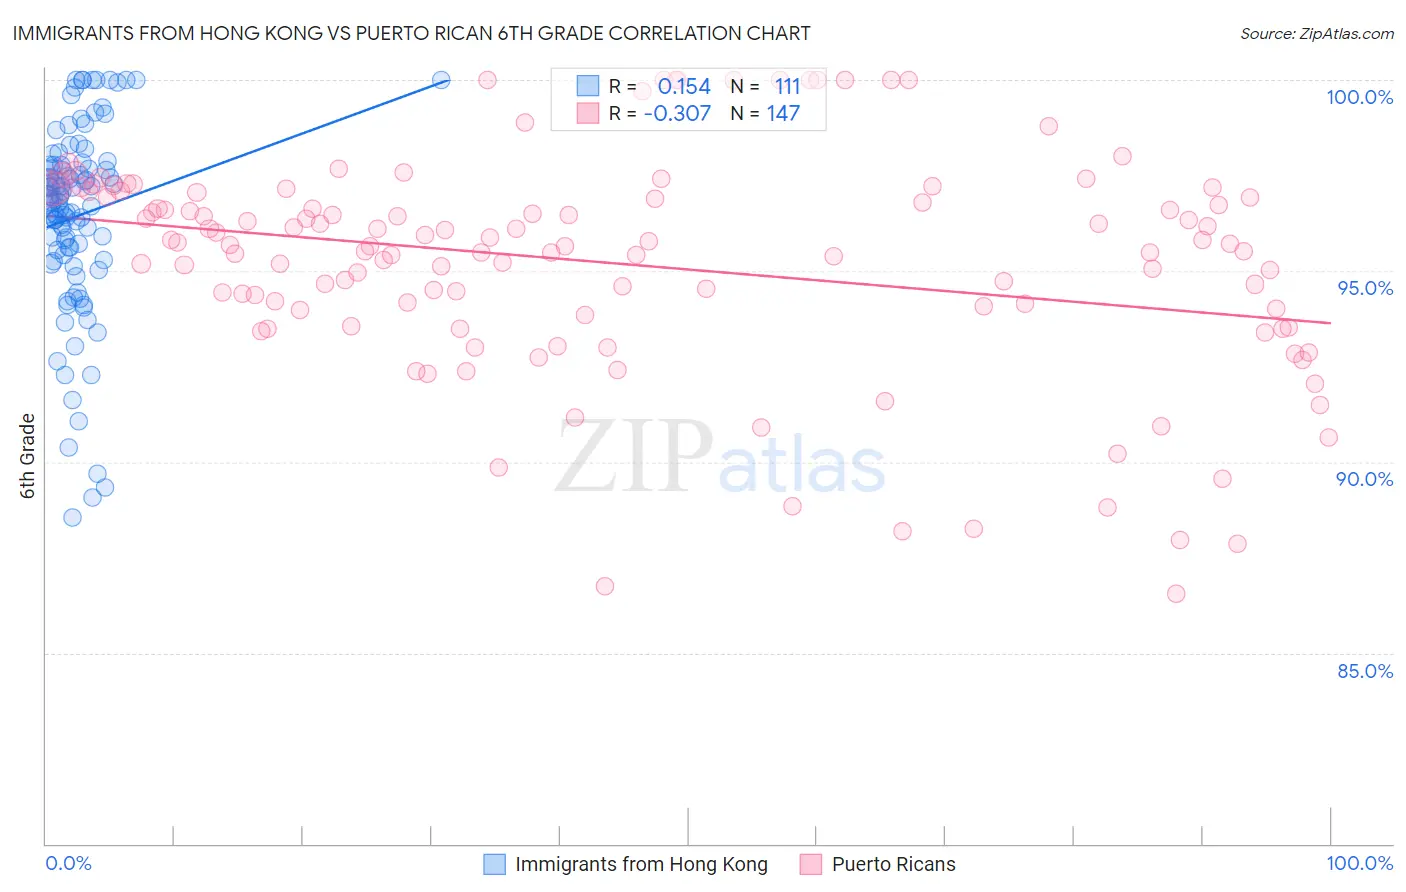
Immigrants from Hong Kong vs Puerto Rican 6th Grade Correlation Chart
The statistical analysis conducted on geographies consisting of 253,909,193 people shows a poor positive correlation between the proportion of Immigrants from Hong Kong and percentage of population with at least 6th grade education in the United States with a correlation coefficient (R) of 0.154 and weighted average of 96.3%. Similarly, the statistical analysis conducted on geographies consisting of 528,320,438 people shows a mild negative correlation between the proportion of Puerto Ricans and percentage of population with at least 6th grade education in the United States with a correlation coefficient (R) of -0.307 and weighted average of 95.5%, a difference of 0.86%.
6th Grade Correlation Summary
| Measurement | Immigrants from Hong Kong | Puerto Rican |
| Minimum | 88.6% | 86.6% |
| Maximum | 100.0% | 100.0% |
| Range | 11.4% | 13.4% |
| Mean | 96.4% | 95.2% |
| Median | 96.9% | 95.7% |
| Interquartile 25% (IQ1) | 95.4% | 93.8% |
| Interquartile 75% (IQ3) | 97.8% | 96.9% |
| Interquartile Range (IQR) | 2.4% | 3.1% |
| Standard Deviation (Sample) | 2.5% | 2.9% |
| Standard Deviation (Population) | 2.5% | 2.8% |
Similar Demographics by 6th Grade
Demographics Similar to Immigrants from Hong Kong by 6th Grade
In terms of 6th grade, the demographic groups most similar to Immigrants from Hong Kong are Immigrants from Uzbekistan (96.3%, a difference of 0.010%), West Indian (96.3%, a difference of 0.010%), Immigrants from South America (96.3%, a difference of 0.010%), Immigrants from Bolivia (96.3%, a difference of 0.030%), and Ghanaian (96.4%, a difference of 0.040%).
| Demographics | Rating | Rank | 6th Grade |
| Armenians | 0.3 /100 | #264 | Tragic 96.4% |
| Immigrants | Jamaica | 0.2 /100 | #265 | Tragic 96.4% |
| Ghanaians | 0.2 /100 | #266 | Tragic 96.4% |
| Afghans | 0.2 /100 | #267 | Tragic 96.4% |
| Immigrants | Uzbekistan | 0.2 /100 | #268 | Tragic 96.3% |
| West Indians | 0.2 /100 | #269 | Tragic 96.3% |
| Immigrants | South America | 0.2 /100 | #270 | Tragic 96.3% |
| Immigrants | Hong Kong | 0.2 /100 | #271 | Tragic 96.3% |
| Immigrants | Bolivia | 0.1 /100 | #272 | Tragic 96.3% |
| Immigrants | Cameroon | 0.1 /100 | #273 | Tragic 96.3% |
| Immigrants | Philippines | 0.1 /100 | #274 | Tragic 96.3% |
| Immigrants | Ghana | 0.1 /100 | #275 | Tragic 96.3% |
| Yaqui | 0.1 /100 | #276 | Tragic 96.3% |
| Immigrants | Western Africa | 0.1 /100 | #277 | Tragic 96.3% |
| Immigrants | Thailand | 0.1 /100 | #278 | Tragic 96.3% |
Demographics Similar to Puerto Ricans by 6th Grade
In terms of 6th grade, the demographic groups most similar to Puerto Ricans are Ecuadorian (95.5%, a difference of 0.010%), Immigrants from Portugal (95.5%, a difference of 0.030%), Immigrants from Guyana (95.5%, a difference of 0.040%), Immigrants from Caribbean (95.6%, a difference of 0.050%), and Guyanese (95.6%, a difference of 0.060%).
| Demographics | Rating | Rank | 6th Grade |
| Immigrants | Burma/Myanmar | 0.0 /100 | #302 | Tragic 95.7% |
| Bangladeshis | 0.0 /100 | #303 | Tragic 95.7% |
| Indonesians | 0.0 /100 | #304 | Tragic 95.6% |
| Immigrants | Cuba | 0.0 /100 | #305 | Tragic 95.6% |
| Immigrants | Haiti | 0.0 /100 | #306 | Tragic 95.6% |
| Guyanese | 0.0 /100 | #307 | Tragic 95.6% |
| Immigrants | Caribbean | 0.0 /100 | #308 | Tragic 95.6% |
| Puerto Ricans | 0.0 /100 | #309 | Tragic 95.5% |
| Ecuadorians | 0.0 /100 | #310 | Tragic 95.5% |
| Immigrants | Portugal | 0.0 /100 | #311 | Tragic 95.5% |
| Immigrants | Guyana | 0.0 /100 | #312 | Tragic 95.5% |
| Nicaraguans | 0.0 /100 | #313 | Tragic 95.4% |
| Immigrants | Vietnam | 0.0 /100 | #314 | Tragic 95.4% |
| Immigrants | Bangladesh | 0.0 /100 | #315 | Tragic 95.4% |
| Japanese | 0.0 /100 | #316 | Tragic 95.4% |