Immigrants from Kenya vs Immigrants from Northern Africa 6th Grade
COMPARE
Immigrants from Kenya
Immigrants from Northern Africa
6th Grade
6th Grade Comparison
Immigrants from Kenya
Immigrants from Northern Africa
97.0%
6TH GRADE
45.3/ 100
METRIC RATING
179th/ 347
METRIC RANK
96.9%
6TH GRADE
15.7/ 100
METRIC RATING
199th/ 347
METRIC RANK
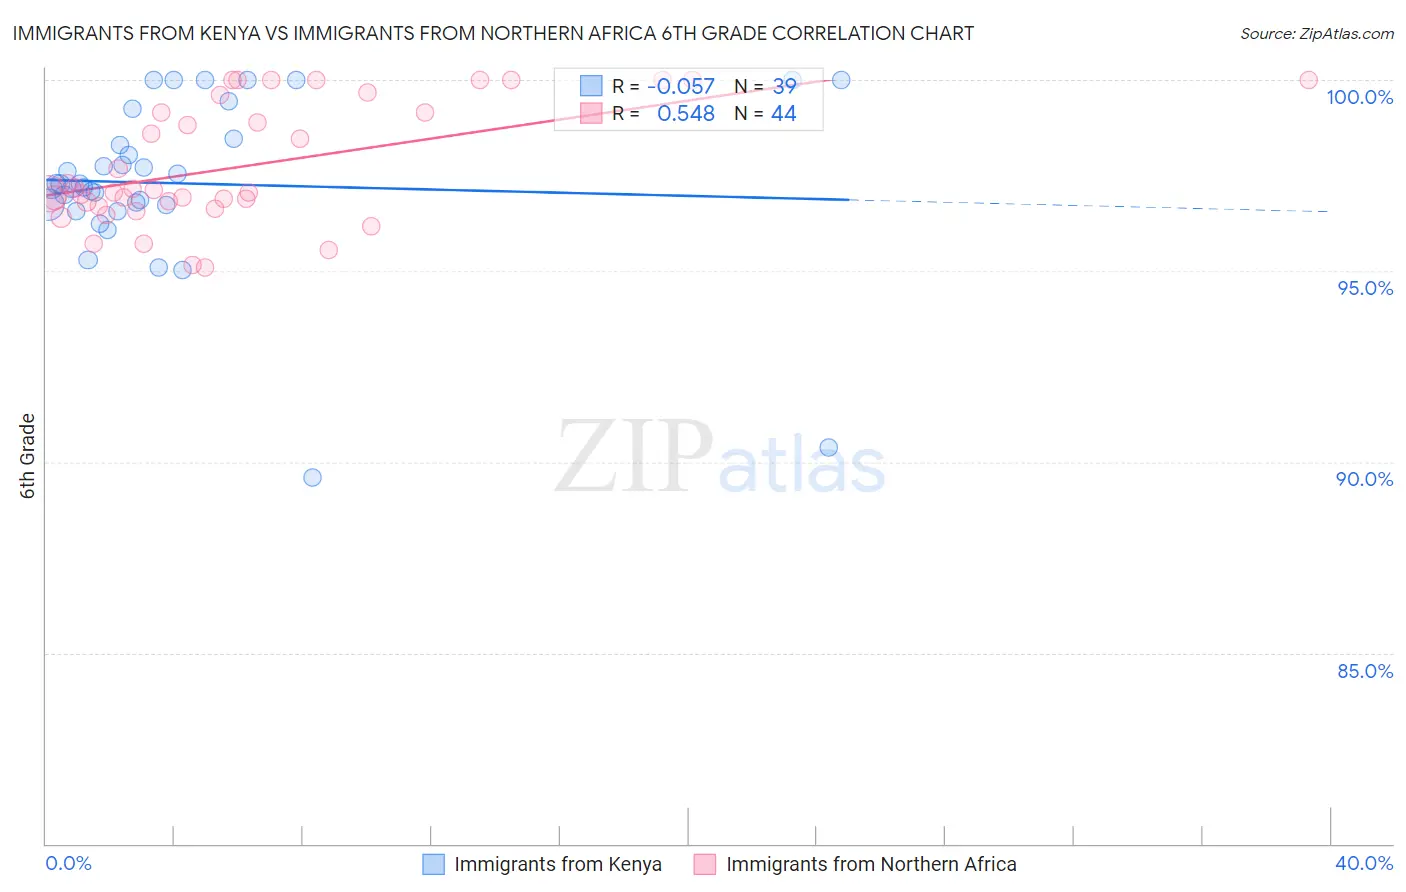
Immigrants from Kenya vs Immigrants from Northern Africa 6th Grade Correlation Chart
The statistical analysis conducted on geographies consisting of 218,076,690 people shows a slight negative correlation between the proportion of Immigrants from Kenya and percentage of population with at least 6th grade education in the United States with a correlation coefficient (R) of -0.057 and weighted average of 97.0%. Similarly, the statistical analysis conducted on geographies consisting of 321,196,768 people shows a substantial positive correlation between the proportion of Immigrants from Northern Africa and percentage of population with at least 6th grade education in the United States with a correlation coefficient (R) of 0.548 and weighted average of 96.9%, a difference of 0.17%.
6th Grade Correlation Summary
| Measurement | Immigrants from Kenya | Immigrants from Northern Africa |
| Minimum | 89.6% | 95.1% |
| Maximum | 100.0% | 100.0% |
| Range | 10.4% | 4.9% |
| Mean | 97.3% | 97.8% |
| Median | 97.3% | 97.1% |
| Interquartile 25% (IQ1) | 96.7% | 96.8% |
| Interquartile 75% (IQ3) | 98.5% | 99.4% |
| Interquartile Range (IQR) | 1.7% | 2.6% |
| Standard Deviation (Sample) | 2.2% | 1.6% |
| Standard Deviation (Population) | 2.2% | 1.6% |
Demographics Similar to Immigrants from Kenya and Immigrants from Northern Africa by 6th Grade
In terms of 6th grade, the demographic groups most similar to Immigrants from Kenya are Immigrants from Spain (97.0%, a difference of 0.030%), Comanche (97.0%, a difference of 0.030%), Immigrants from Ukraine (97.0%, a difference of 0.050%), Immigrants from Venezuela (97.0%, a difference of 0.050%), and Spanish American (97.0%, a difference of 0.060%). Similarly, the demographic groups most similar to Immigrants from Northern Africa are Immigrants from Albania (96.9%, a difference of 0.020%), Brazilian (96.9%, a difference of 0.030%), Immigrants from Uganda (96.9%, a difference of 0.040%), Immigrants from Lebanon (96.9%, a difference of 0.070%), and Immigrants from Brazil (96.9%, a difference of 0.070%).
| Demographics | Rating | Rank | 6th Grade |
| Immigrants | Kenya | 45.3 /100 | #179 | Average 97.0% |
| Immigrants | Spain | 39.9 /100 | #180 | Fair 97.0% |
| Comanche | 37.9 /100 | #181 | Fair 97.0% |
| Immigrants | Ukraine | 35.6 /100 | #182 | Fair 97.0% |
| Immigrants | Venezuela | 34.5 /100 | #183 | Fair 97.0% |
| Spanish Americans | 33.5 /100 | #184 | Fair 97.0% |
| Argentineans | 33.0 /100 | #185 | Fair 97.0% |
| Immigrants | Egypt | 31.4 /100 | #186 | Fair 97.0% |
| Guamanians/Chamorros | 30.6 /100 | #187 | Fair 97.0% |
| Immigrants | Argentina | 30.4 /100 | #188 | Fair 97.0% |
| Blacks/African Americans | 30.2 /100 | #189 | Fair 97.0% |
| Dutch West Indians | 28.3 /100 | #190 | Fair 96.9% |
| Panamanians | 27.3 /100 | #191 | Fair 96.9% |
| Hawaiians | 27.0 /100 | #192 | Fair 96.9% |
| Paraguayans | 26.6 /100 | #193 | Fair 96.9% |
| Immigrants | Lebanon | 25.6 /100 | #194 | Fair 96.9% |
| Immigrants | Brazil | 25.5 /100 | #195 | Fair 96.9% |
| Immigrants | Uganda | 21.2 /100 | #196 | Fair 96.9% |
| Brazilians | 20.1 /100 | #197 | Fair 96.9% |
| Immigrants | Albania | 18.8 /100 | #198 | Poor 96.9% |
| Immigrants | Northern Africa | 15.7 /100 | #199 | Poor 96.9% |