Immigrants from Cambodia vs Puerto Rican 6th Grade
COMPARE
Immigrants from Cambodia
Puerto Rican
6th Grade
6th Grade Comparison
Immigrants from Cambodia
Puerto Ricans
95.2%
6TH GRADE
0.0/ 100
METRIC RATING
322nd/ 347
METRIC RANK
95.5%
6TH GRADE
0.0/ 100
METRIC RATING
309th/ 347
METRIC RANK
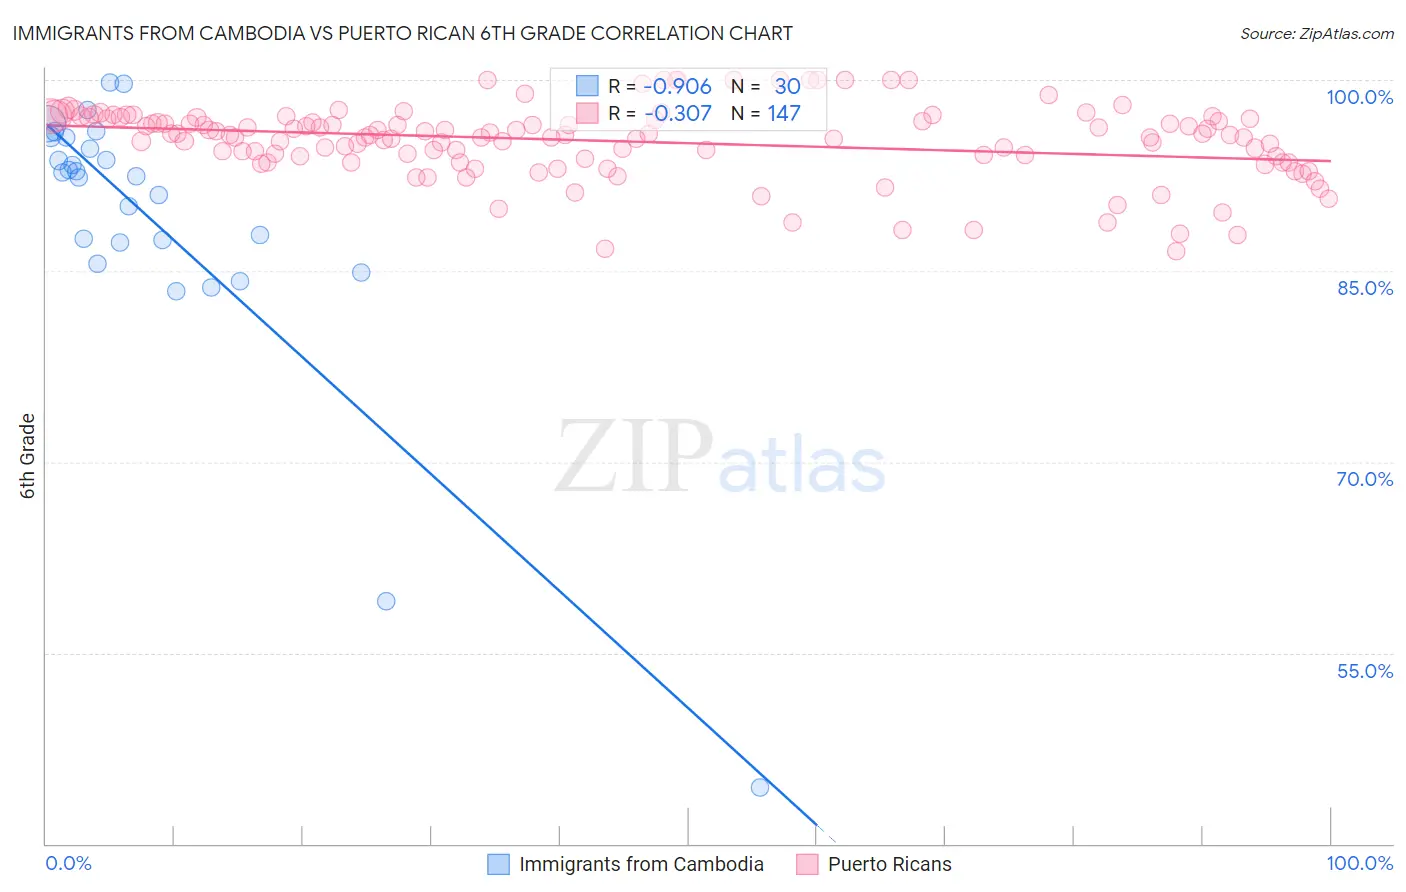
Immigrants from Cambodia vs Puerto Rican 6th Grade Correlation Chart
The statistical analysis conducted on geographies consisting of 205,153,442 people shows a near-perfect negative correlation between the proportion of Immigrants from Cambodia and percentage of population with at least 6th grade education in the United States with a correlation coefficient (R) of -0.906 and weighted average of 95.2%. Similarly, the statistical analysis conducted on geographies consisting of 528,320,438 people shows a mild negative correlation between the proportion of Puerto Ricans and percentage of population with at least 6th grade education in the United States with a correlation coefficient (R) of -0.307 and weighted average of 95.5%, a difference of 0.37%.
6th Grade Correlation Summary
| Measurement | Immigrants from Cambodia | Puerto Rican |
| Minimum | 44.4% | 86.6% |
| Maximum | 99.8% | 100.0% |
| Range | 55.4% | 13.4% |
| Mean | 89.0% | 95.2% |
| Median | 92.6% | 95.7% |
| Interquartile 25% (IQ1) | 87.3% | 93.8% |
| Interquartile 75% (IQ3) | 95.4% | 96.9% |
| Interquartile Range (IQR) | 8.2% | 3.1% |
| Standard Deviation (Sample) | 11.3% | 2.9% |
| Standard Deviation (Population) | 11.1% | 2.8% |
Demographics Similar to Immigrants from Cambodia and Puerto Ricans by 6th Grade
In terms of 6th grade, the demographic groups most similar to Immigrants from Cambodia are Central American Indian (95.1%, a difference of 0.010%), Cape Verdean (95.1%, a difference of 0.040%), Immigrants from Fiji (95.2%, a difference of 0.050%), Immigrants from Nicaragua (95.1%, a difference of 0.070%), and Immigrants from Ecuador (95.3%, a difference of 0.12%). Similarly, the demographic groups most similar to Puerto Ricans are Ecuadorian (95.5%, a difference of 0.010%), Immigrants from Portugal (95.5%, a difference of 0.030%), Immigrants from Guyana (95.5%, a difference of 0.040%), Immigrants from Caribbean (95.6%, a difference of 0.050%), and Guyanese (95.6%, a difference of 0.060%).
| Demographics | Rating | Rank | 6th Grade |
| Immigrants | Cuba | 0.0 /100 | #305 | Tragic 95.6% |
| Immigrants | Haiti | 0.0 /100 | #306 | Tragic 95.6% |
| Guyanese | 0.0 /100 | #307 | Tragic 95.6% |
| Immigrants | Caribbean | 0.0 /100 | #308 | Tragic 95.6% |
| Puerto Ricans | 0.0 /100 | #309 | Tragic 95.5% |
| Ecuadorians | 0.0 /100 | #310 | Tragic 95.5% |
| Immigrants | Portugal | 0.0 /100 | #311 | Tragic 95.5% |
| Immigrants | Guyana | 0.0 /100 | #312 | Tragic 95.5% |
| Nicaraguans | 0.0 /100 | #313 | Tragic 95.4% |
| Immigrants | Vietnam | 0.0 /100 | #314 | Tragic 95.4% |
| Immigrants | Bangladesh | 0.0 /100 | #315 | Tragic 95.4% |
| Japanese | 0.0 /100 | #316 | Tragic 95.4% |
| Vietnamese | 0.0 /100 | #317 | Tragic 95.3% |
| Belizeans | 0.0 /100 | #318 | Tragic 95.3% |
| Immigrants | Belize | 0.0 /100 | #319 | Tragic 95.3% |
| Immigrants | Ecuador | 0.0 /100 | #320 | Tragic 95.3% |
| Immigrants | Fiji | 0.0 /100 | #321 | Tragic 95.2% |
| Immigrants | Cambodia | 0.0 /100 | #322 | Tragic 95.2% |
| Central American Indians | 0.0 /100 | #323 | Tragic 95.1% |
| Cape Verdeans | 0.0 /100 | #324 | Tragic 95.1% |
| Immigrants | Nicaragua | 0.0 /100 | #325 | Tragic 95.1% |